Main Quotes Calendar Forum
flag

FX.co ★ Technical analysis of NZD/USD for August 4, 2017

parent
Forex Analysis:::2017-08-04T07:36:09

Technical analysis of NZD/USD for August 4, 2017

The NZD/USD is in a bearish short-term trend as long as price is below 0.7525. Price is making lower lows and lower highs since July 27th. I expect more Dollar strength to push this pair towards 0.73-0.7260 at least.

Technical analysis of NZD/USD for August 4, 2017

Blue lines - bearish channel

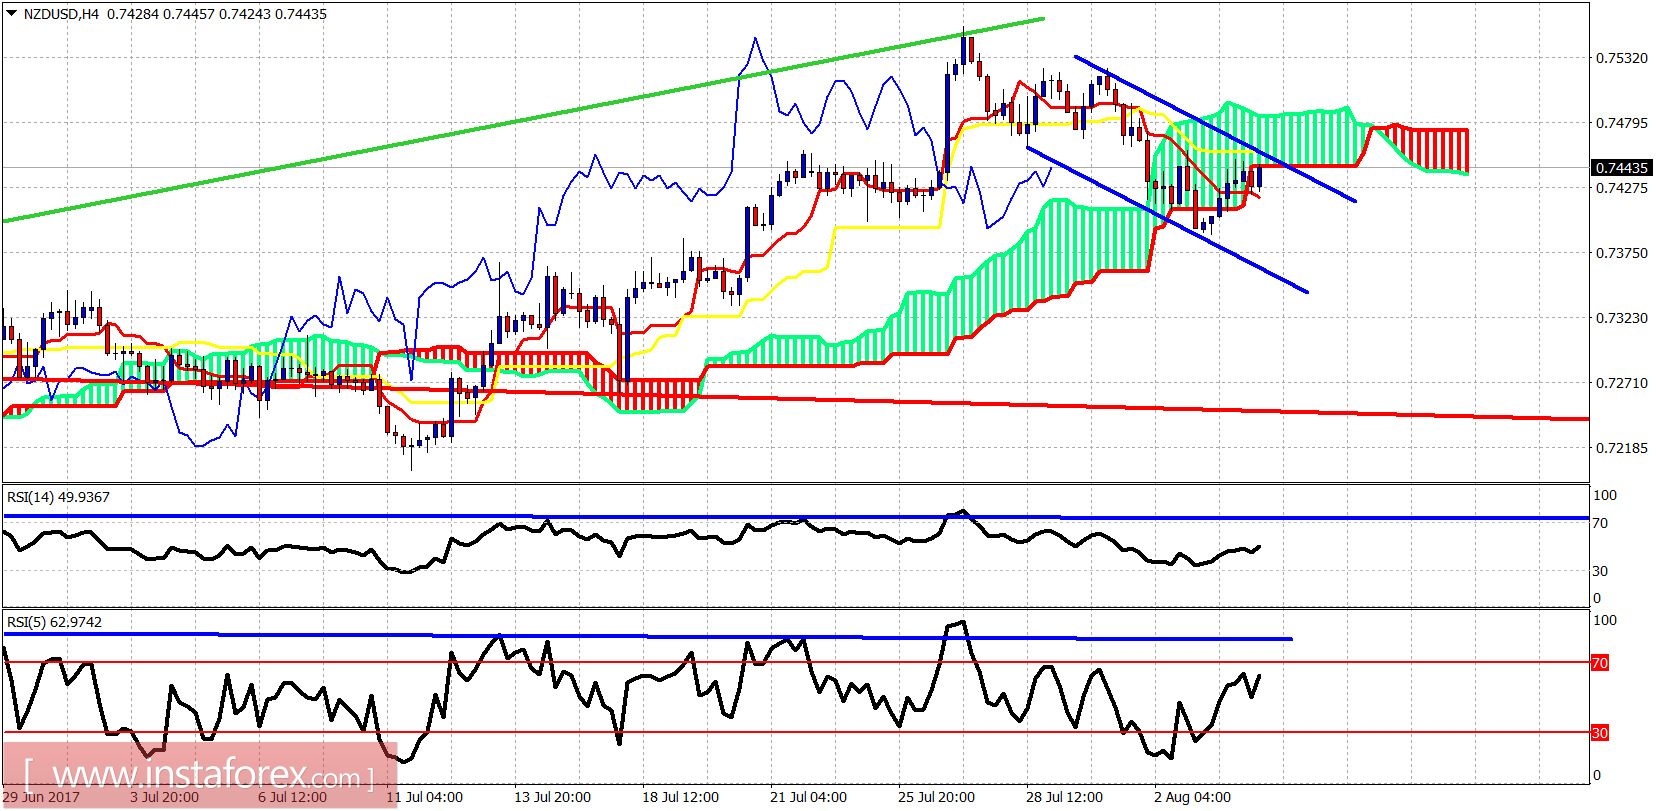
The NZD/USD is inside a bearish short-term channel. Channel resistance is at 0.7455. In this area, we also find the resistance by the Ichimoku cloud. So price has turned back up to back test the breakdown of the cloud....holding below the cloud will strengthen our bearish scenario for a move lower.

Technical analysis of NZD/USD for August 4, 2017

In the daily chart we said in our previous post that since price broke down below the tenkan-sen, we should expect at least a test of the kijun-sen (yellow line indicator). So this is what happened. Price reached very close to the kijun-sen and bounced strongly. A rejection by the tenkan-sen will increase the chances of a move to new lows towards the Kumo at 0.7260.
Analyst InstaForex
Share this article:
parent
loader...
all-was_read__icon
You have watched all the best publications
presently.
We are already looking for something interesting for you...
all-was_read__star
Recently published:
loader...
More recent publications...