Main Quotes Calendar Forum
flag

FX.co ★ Ichimoku indicator analysis of gold for August 9, 2017

parent
Forex Analysis:::2017-08-08T22:54:13

Ichimoku indicator analysis of gold for August 9, 2017

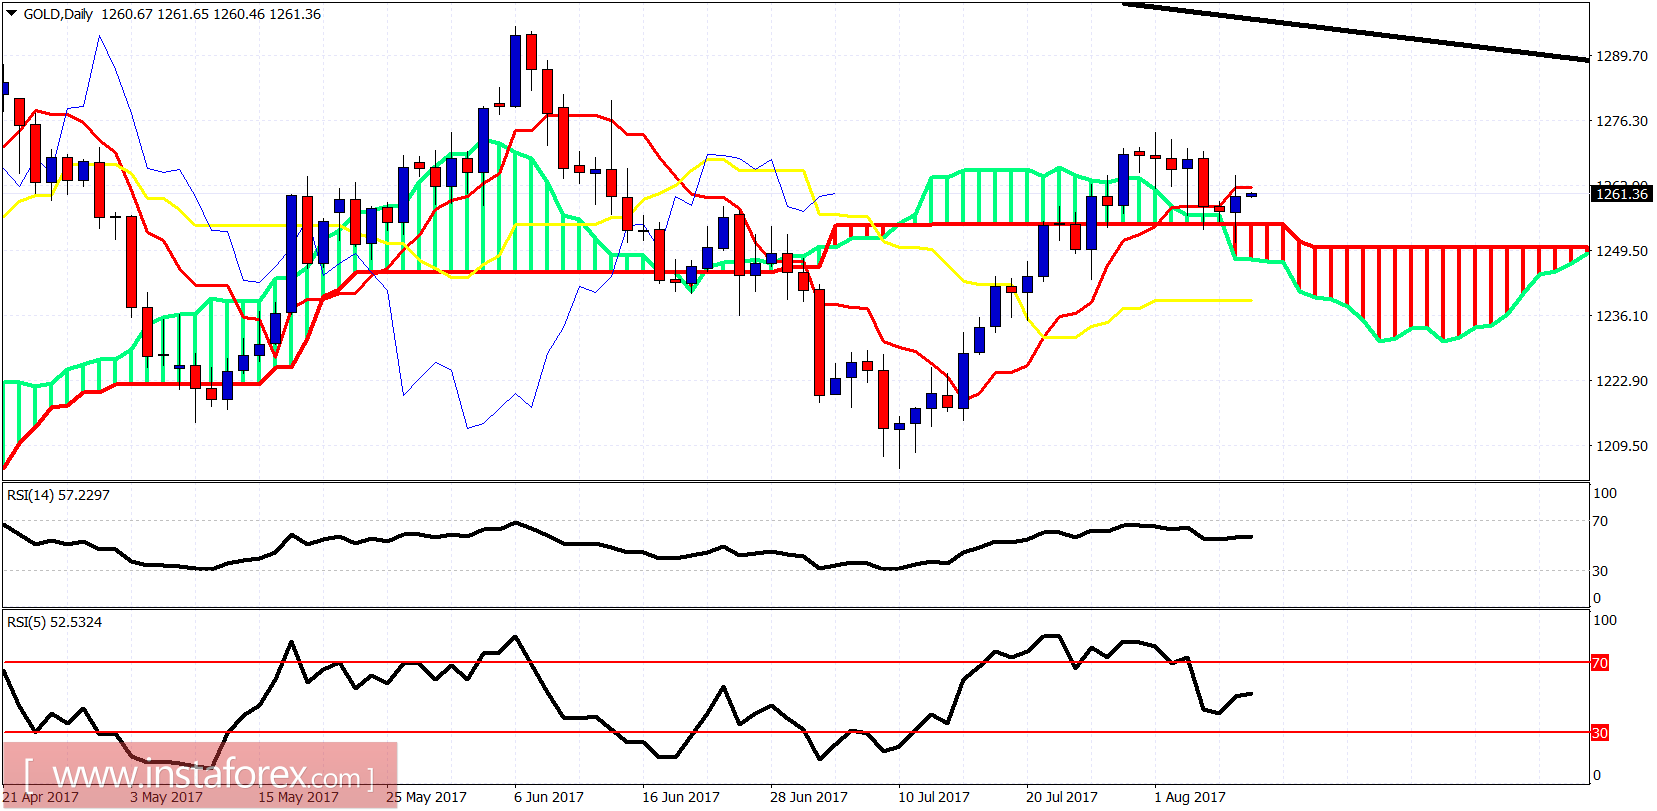
Gold price has reached very close to our minimum pull back to target and daily Kumo (cloud) support at $1,250 as expected and is bouncing. Price remains trapped inside the short-term bearish channel and short term trend remains neutral or slightly bearish. The longer-term view remains bullish.

Ichimoku indicator analysis of gold for August 9, 2017Ichimoku indicator analysis of gold for August 9, 2017Ichimoku indicator analysis of gold for August 9, 2017

Red lines - bearish channel

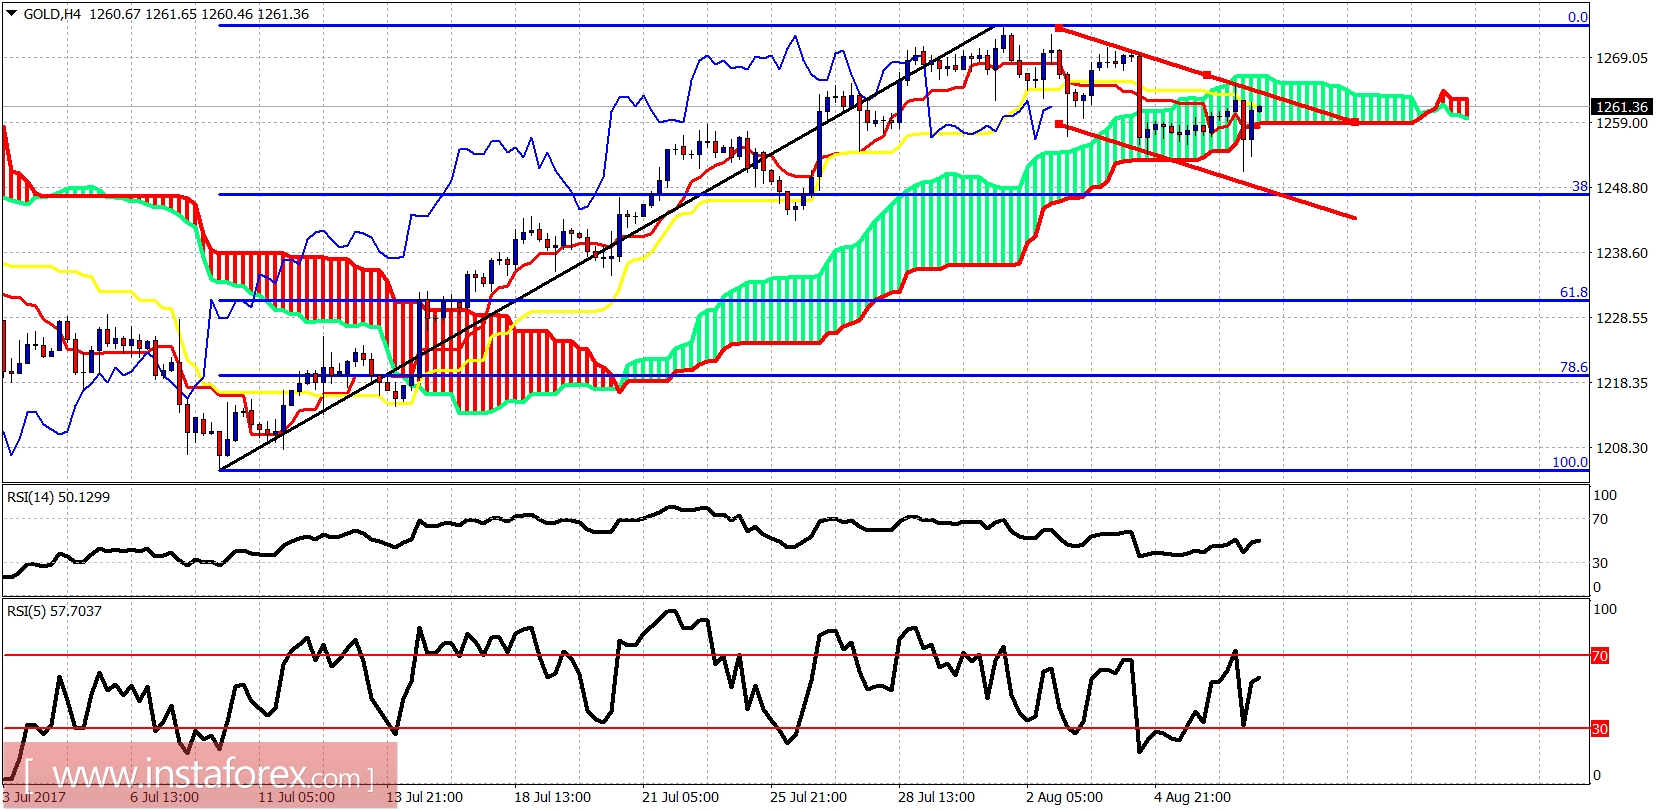
Gold price is trading inside the Kumo. The trend is neutral. Short-term support is at $1,249 (38% Fibonacci retracement). Resistance is at $1,257.

Ichimoku indicator analysis of gold for August 9, 2017

Ichimoku indicator analysis of gold for August 9, 2017

On a daily basis, we have seen price back test the broken daily cloud. Price is now bouncing but is below the tenkan-sen. However, I believe we could still see a move lower to re-test the cloud before the next upwards move. A break above $1,273 will cancel any move lower.
Analyst InstaForex
Share this article:
parent
loader...
all-was_read__icon
You have watched all the best publications
presently.
We are already looking for something interesting for you...
all-was_read__star
Recently published:
loader...
More recent publications...