


As we said in our previous post the topping process for EUR/USD is over. As everyone was waiting for the pair to get to 1.20, now everyone was bullish...but the wedge pattern broke to the downside confirming the trend reversal.
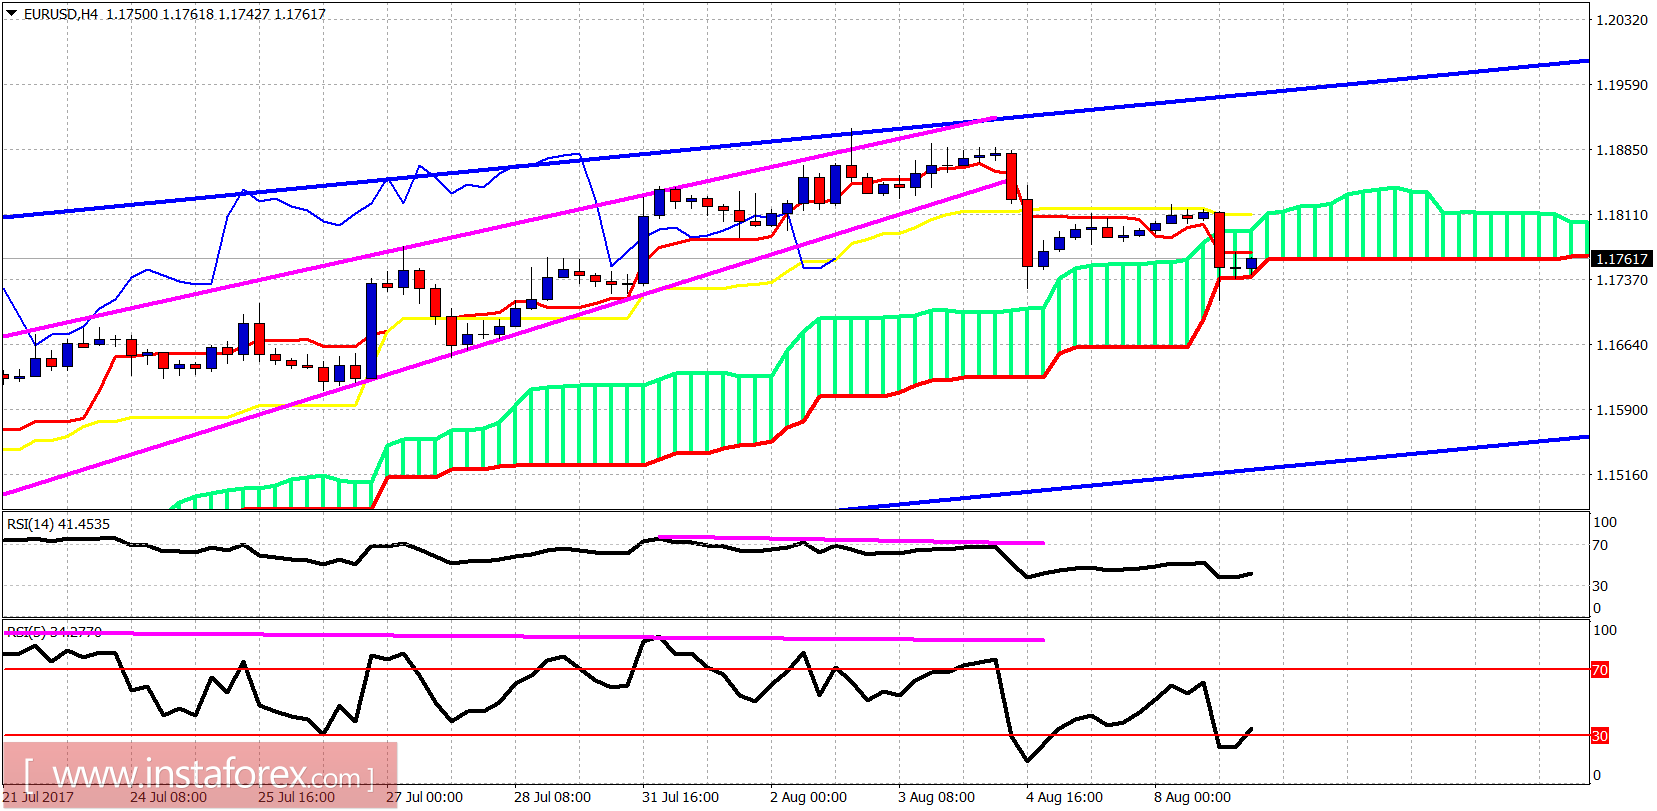
The price is about to break the 4-hour Kumo (cloud) support. The price is making lower lows and lower highs. Short-term resistance is at 1.1820 and support is at 1.17. My target remains between 1.1550-1.14. EUR/USD is in a corrective phase that is expected to push price towards the lower channel boundaries.
Blue lines - bullish channel
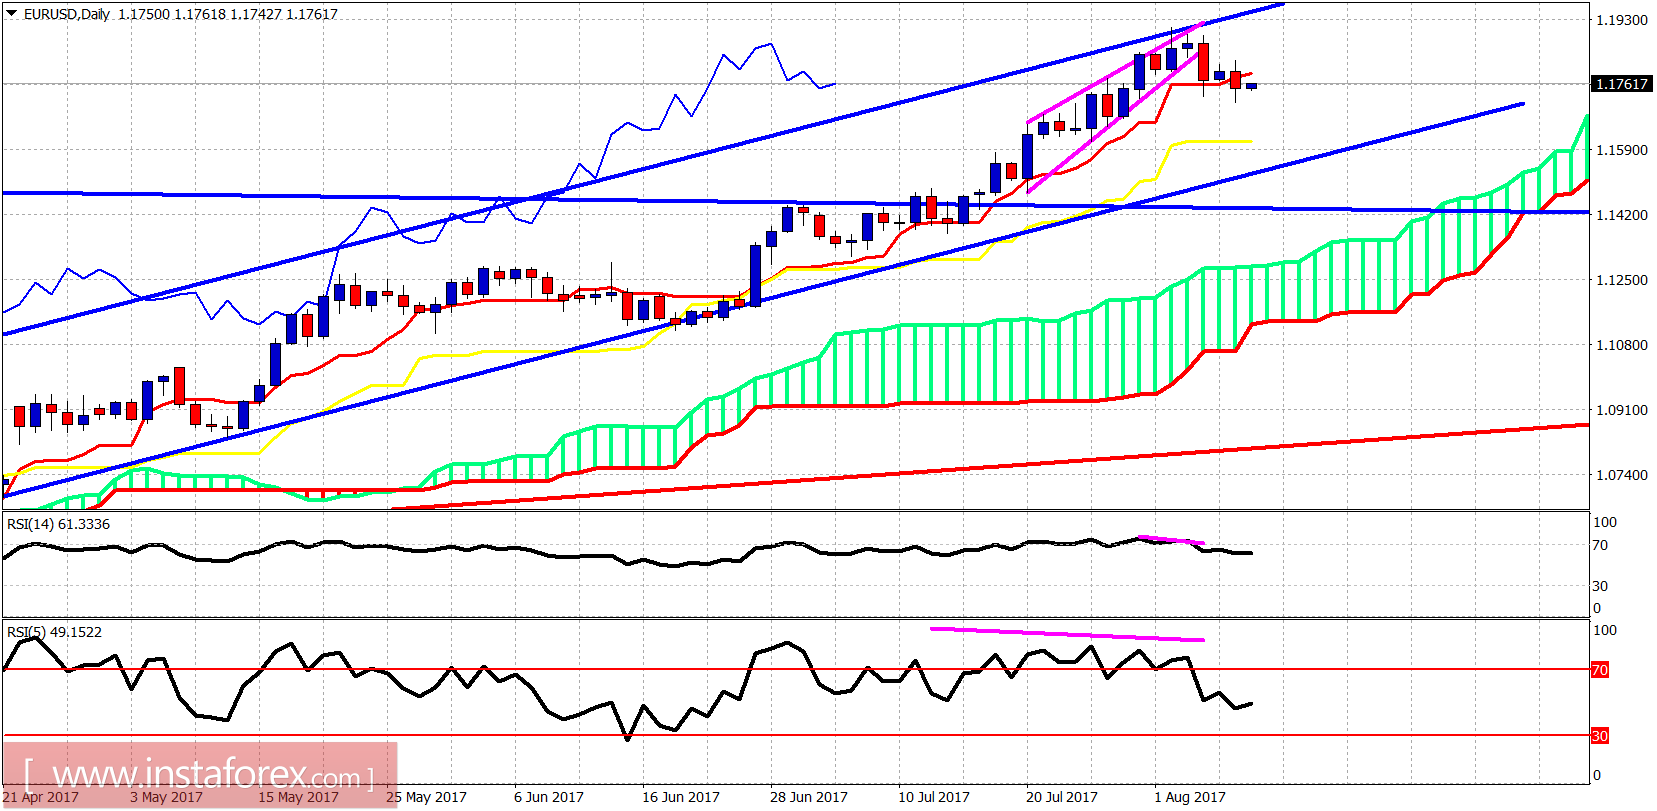
On a daily basis the bearish divergence by the oscillators combined with the break out of the wedge pattern and the daily close below the tenkan-sen (red line indicator), implies that we have started a counter trend move lower. The target is the 15.50-1.14 area. The longer-term trend remains bullish.


