


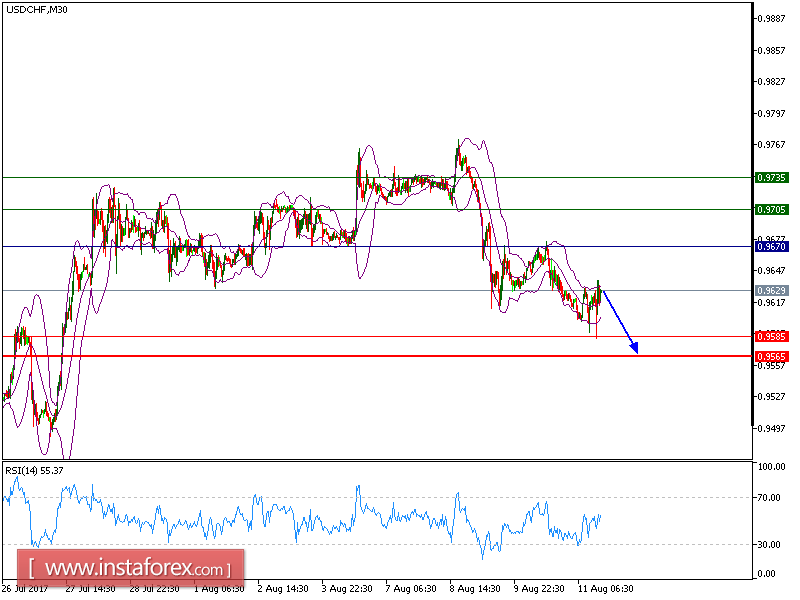
USD/CHF is under pressure and expected to trade in lower range. The pair retreated from 0.9670 (the high of August 10). The 20-period moving average crossed below the 50-period one.
To sum up, as long as 0.9670 is not surpassed, a further drop to 0.9605 and even to 0.9565 seems more likely to occur.
Chart Explanation: The black line shows the pivot point. The present price above the pivot point indicates the bullish position; and the price below the pivot points indicates the short position. The red lines show the support levels and the green line indicates the resistance levels. These levels can be used to enter and exit trades.
Strategy: SELL, Stop Loss: 0.9670, Take Profit: 0.9585
Resistance levels: 0.9705, 0.9735, and 0.9770
Support levels: 0.9585, 0.9565, and 0.9525


