


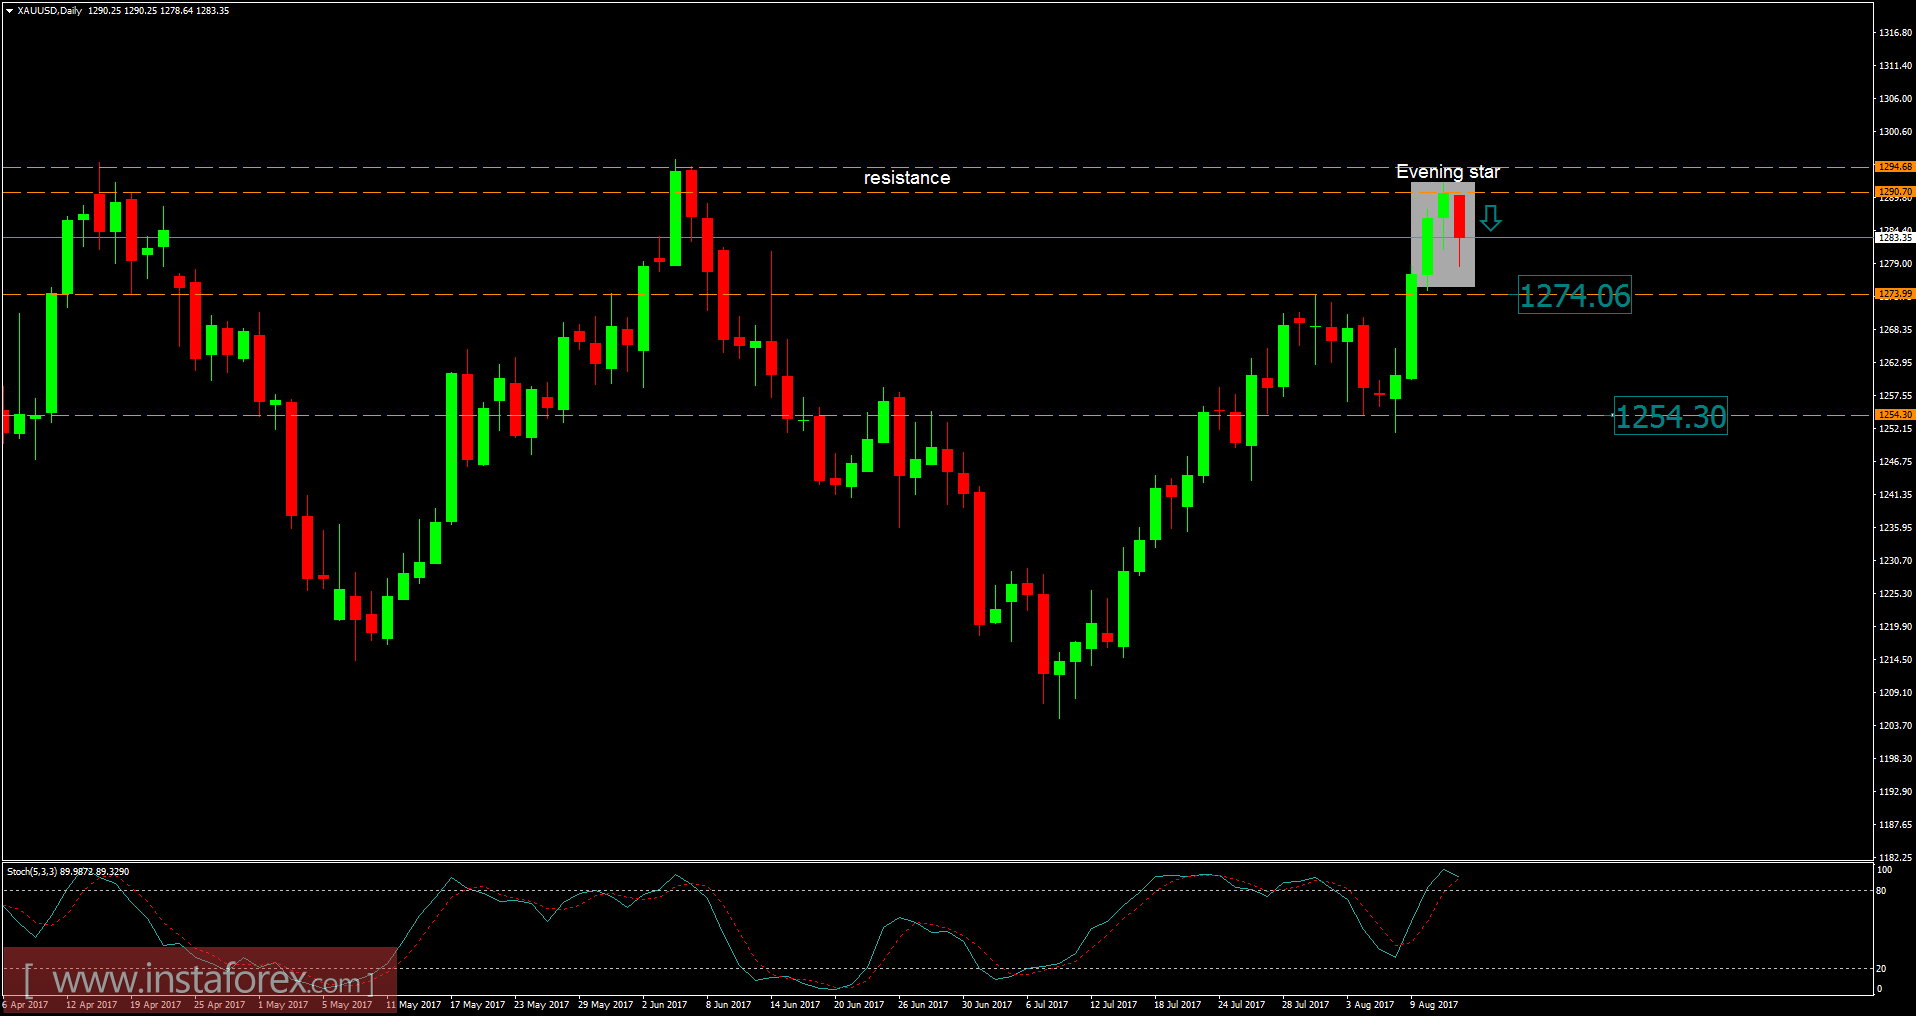
Recently, gold has been trading sideways at the price of $1,283.00. According to the daily time frame, I found a rejection from the strong resistance at the price of $1,290.00, which is a sign that buying looks risky. There is also an evening star formation (bearish formation), which is another sign of weakness. I added Stochastic oscilator and got overbought conditions. My advice is to watch for potential selling opportunities. The downward targets are set at the price of $1,274.00 and $1,254.00.
Resistance levels:
R1: $1,295.75
R2: $1,296.75
R3: $1,298.00
Support levels:
S1: $1,293.52
S2: $1,295.35
S3: $1,291.15
Trading recommendations for today: watch for potential selling opportunities.


