


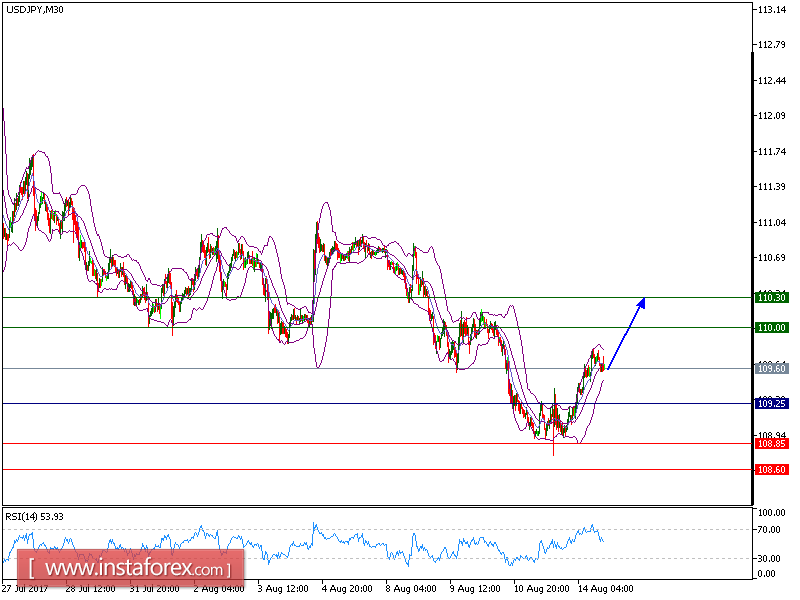
USD/JPY is expected to trade in higher range. Although the pair posted a pullback, it is still trading above its rising 20-period and 50-period moving averages. The relative strength index is above its neutrality level at 50. Even though a continuation of the consolidation cannot be ruled out, its extent should be limited.
To sum up, while the price is above 109.25, look for a further advance to 110.00 and even to 110.30 in extension.
Alternatively, if the price moves in the opposite direction, a short position is recommended below 109.25 with a target at 108.85.
Chart Explanation: The black line shows the pivot point. The current price above the pivot point indicates a bullish position, while the price below the pivot point is a signal for a short position. The red lines show the support levels and the green line indicates the resistance level. These levels can be used to enter and exit trades.
Strategy: SELL, Stop Loss: 109.50, Take Profit: 108.60
Resistance levels: 110.00, 110.30, and 110.55
Support Levels: 108.85, 108.60, 108.25


