Main Quotes Calendar Forum
flag

FX.co ★ Ichimoku indicator analysis of gold for August 16, 2017

parent
Forex Analysis:::2017-08-15T22:08:15

Ichimoku indicator analysis of gold for August 16, 2017

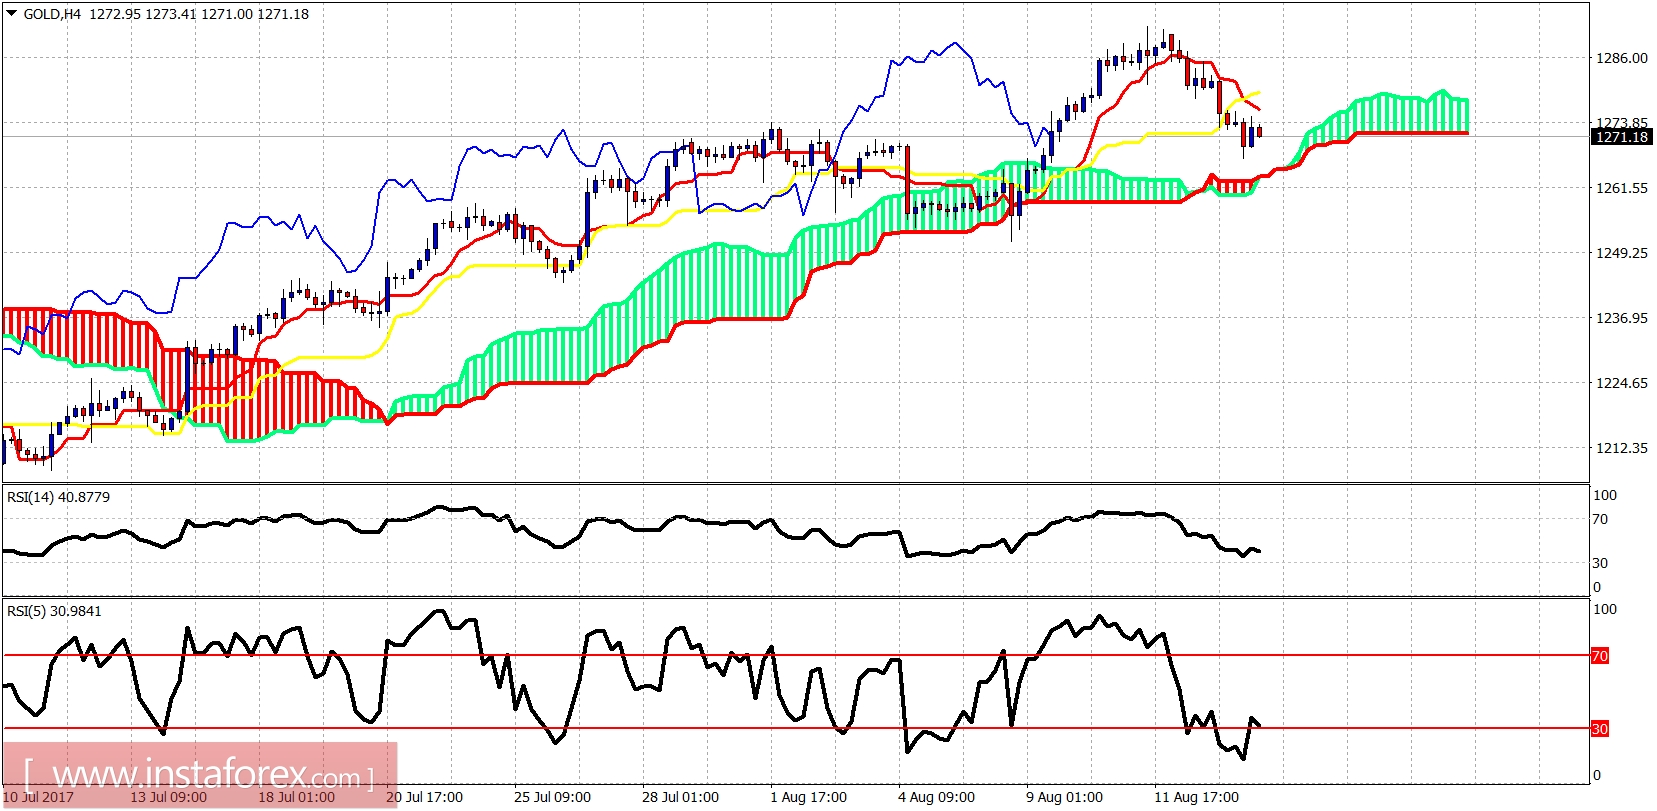
Gold is pulling back but the overall trend remains bullish. We have a weekly breakout and a back test in play. A short-term support that could justify a reversal is very close.

Ichimoku indicator analysis of gold for August 16, 2017

In the 4-hour chart, the price is above the Kumo. RSI (5) is oversold and turning higher. Support is at $1,260. I see low chances of moving below the cloud. It is highly possible to see an upward reversal soon to new highs above $1,300. Resistance is at $1,280.

Ichimoku indicator analysis of gold for August 16, 2017

Black line -long-term resistance

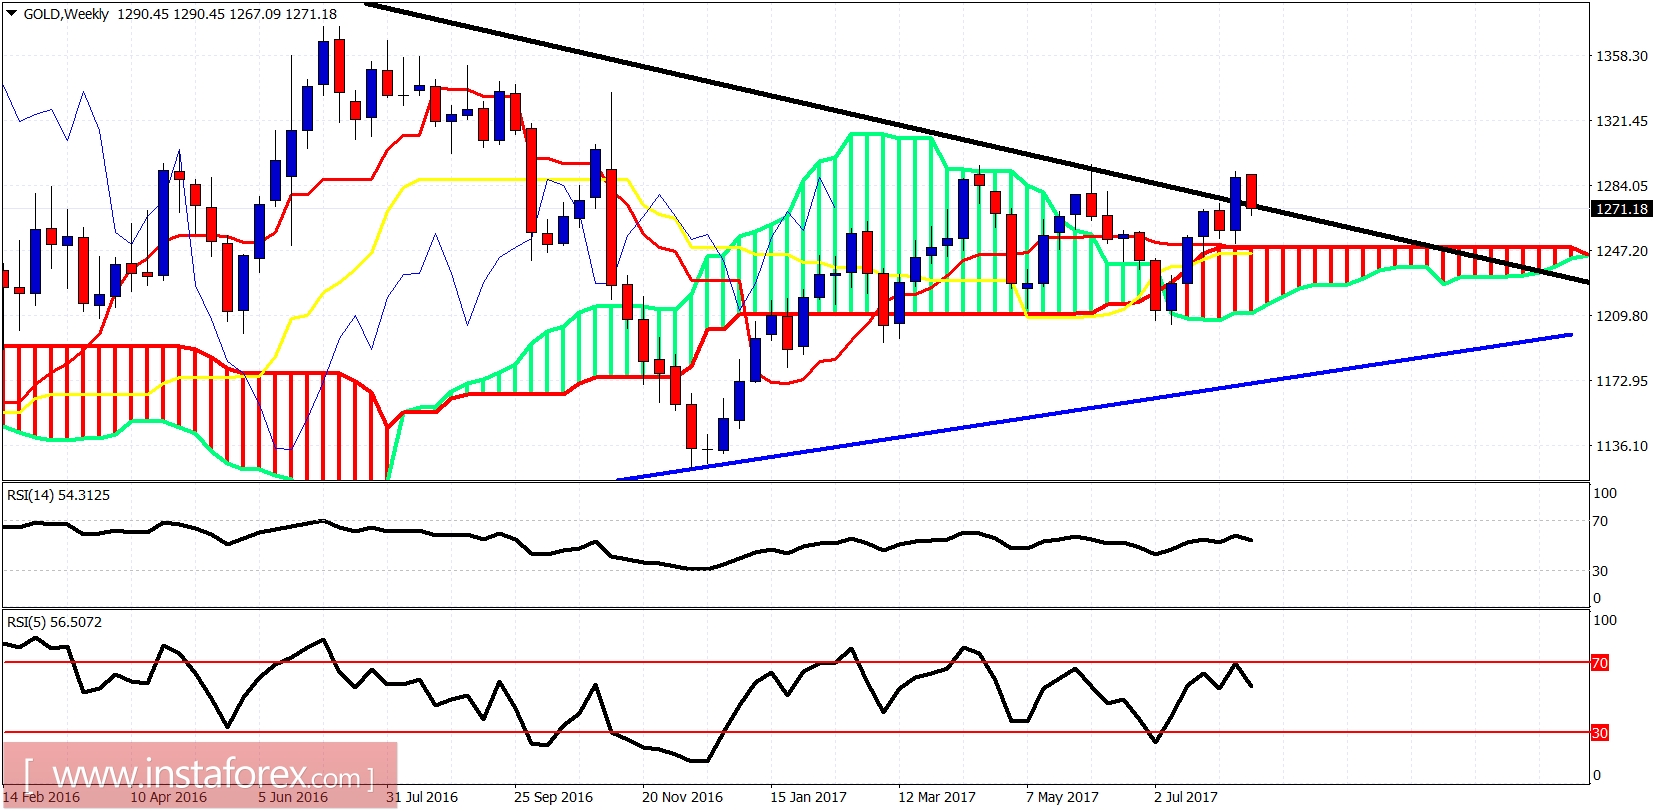
Blue line -long-term support

The gold price has broken last week above the long-term trend line resistance. This week we see a back test. I expect the price to hold above it and continue higher towards $1,450 over the coming months.

Analyst InstaForex
Share this article:
parent
loader...
all-was_read__icon
You have watched all the best publications
presently.
We are already looking for something interesting for you...
all-was_read__star
Recently published:
loader...
More recent publications...