


The index is looking to break above 94.11 in an effort to strengthen the bullish bias across the board. However, such resistance is limiting gains and if USDX pulls back at the current stage, then the 200 SMA at H1 chart can be re-tested, opening the doors to reach the support level of 93.28 in the worst-case scenario. MACD indicator is entering the neutral territory, calling for sideways.
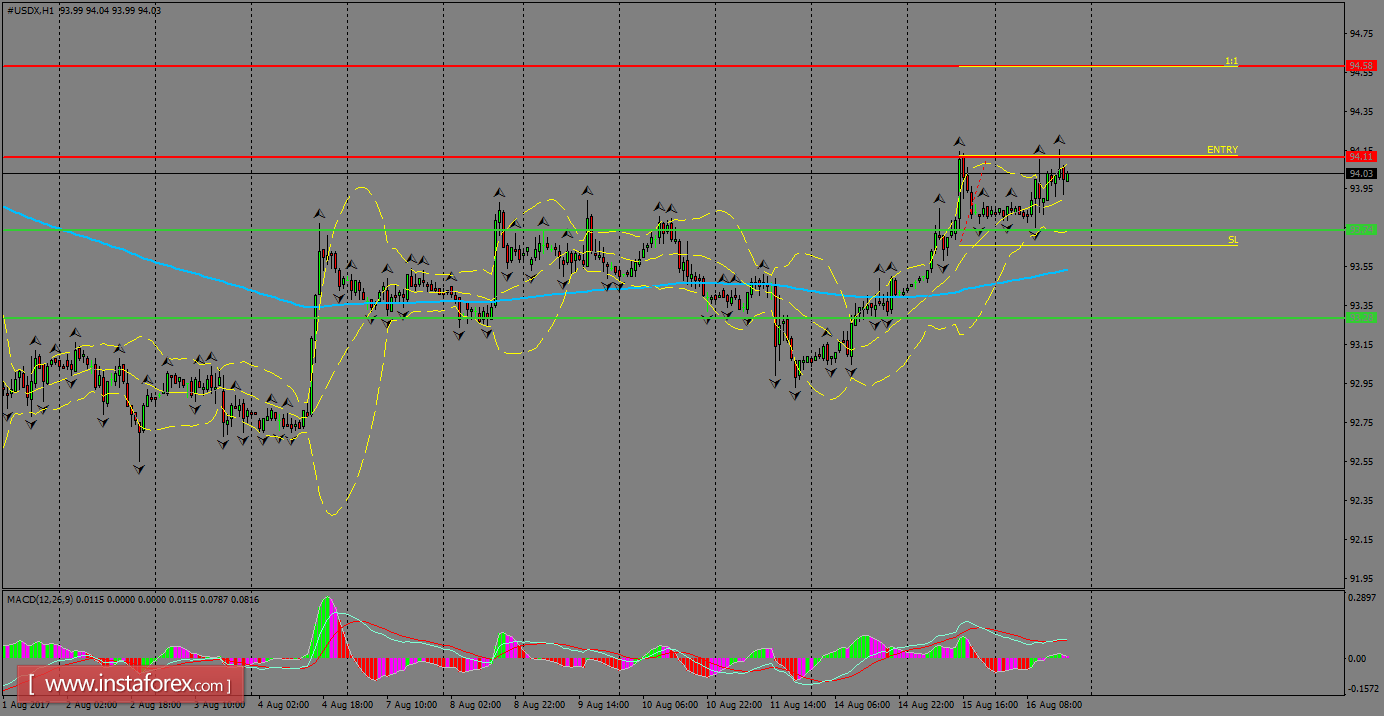
H1 chart's resistance levels: 94.11 / 94.58
H1 chart's support levels: 93.74 / 93.28
Trading recommendations for today: Based on the H1 chart, place buy (long) orders only if the USD Index breaks with a bullish candlestick; the resistance level is at 94.11, take profit is at 94.58 and stop loss is at 93.66.


