Main Quotes Calendar Forum
flag

FX.co ★ Ichimoku indicator analysis of USDX for August 17, 2017

parent
Forex Analysis:::2017-08-16T22:35:45

Ichimoku indicator analysis of USDX for August 17, 2017

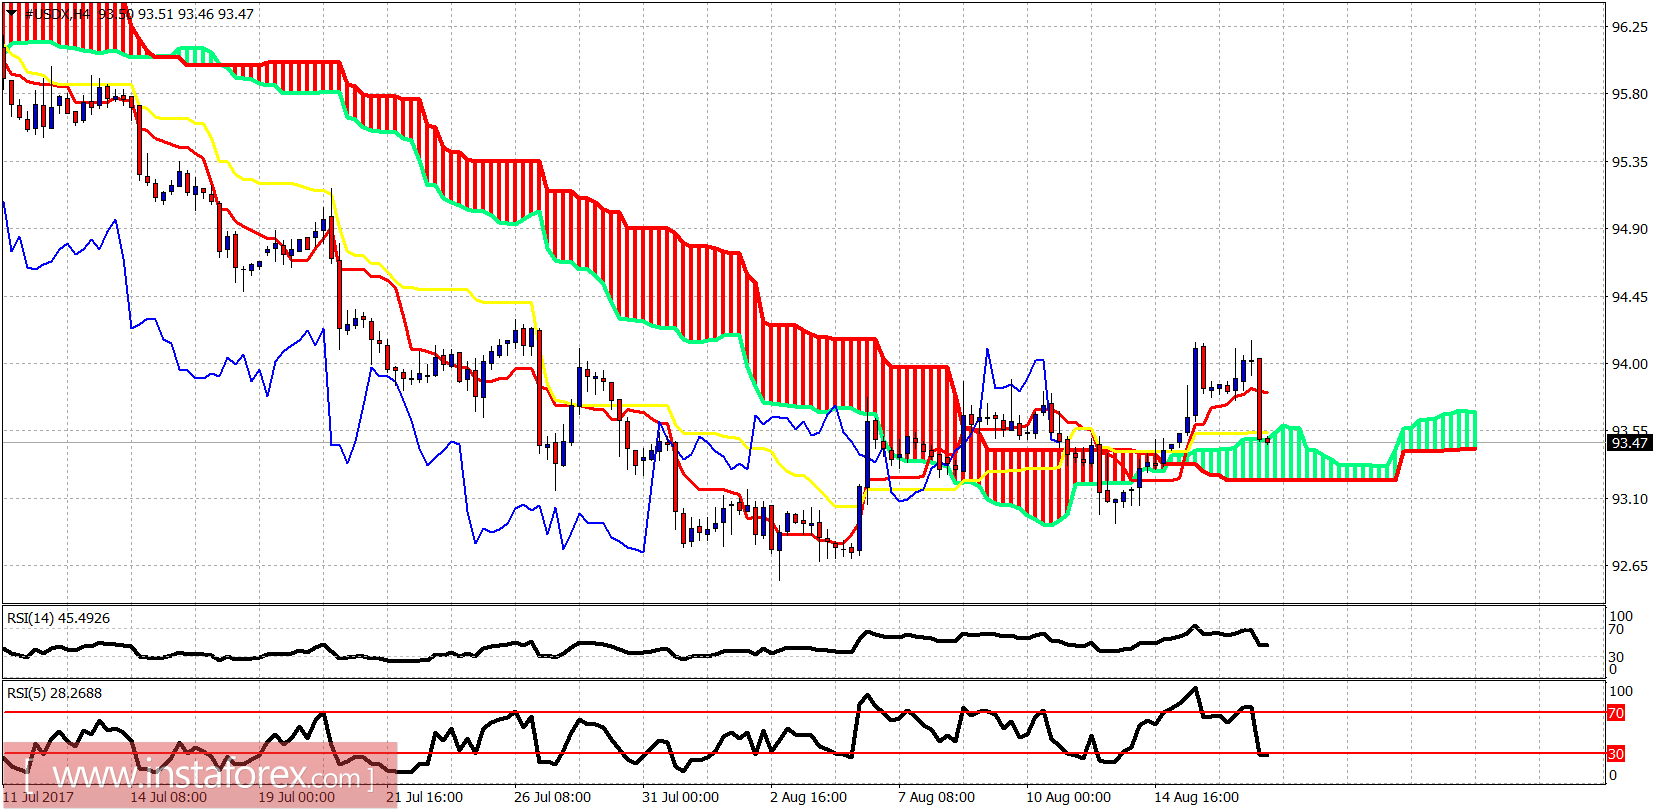
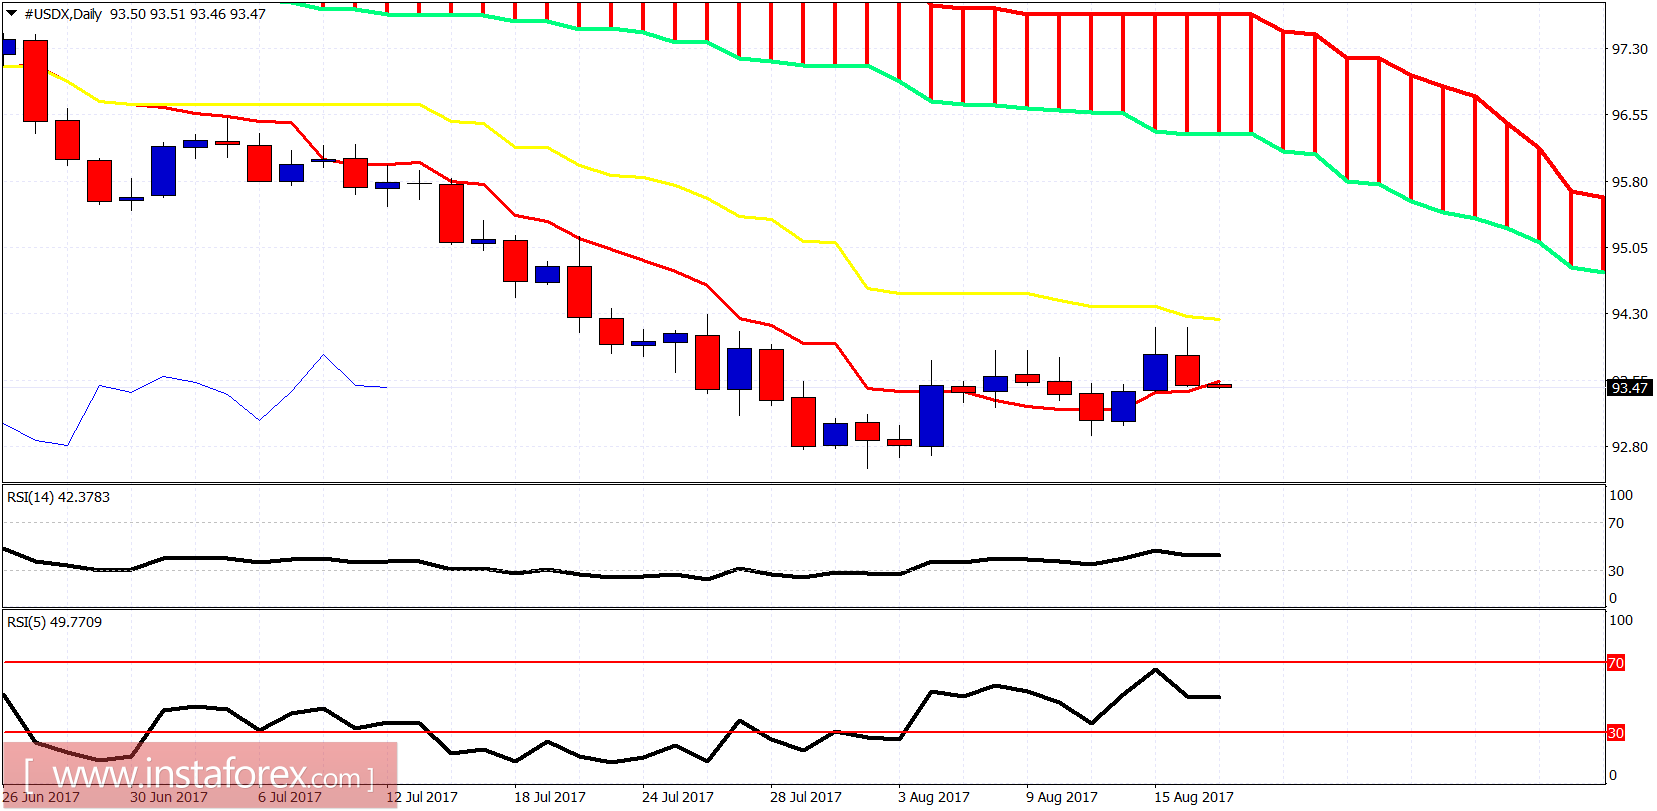
The Dollar index shows some reversal signs and although trend remains bullish the upside potential looks weak and the expected bounce could already have been completed. Bulls need to be very cautious.

Ichimoku indicator analysis of USDX for August 17, 2017

The price is back testing short-term support at the 4-hour chart. Support is at 93.40-93.20 level. The price has not made a lower low yet. A break below this support will open the way for a move towards 91. Resistance at 94.30.

Ichimoku indicator analysis of USDX for August 17, 2017

On a daily basis, it seems that we have a rejection at the daily kijun-sen (yellow line indicator) resistance. This is not a good sign and if we combine it with a daily close below the tenkan-sen (red line indicator) then we get a sell signal that will imply new lows are coming for the index.
Analyst InstaForex
Share this article:
parent
loader...
all-was_read__icon
You have watched all the best publications
presently.
We are already looking for something interesting for you...
all-was_read__star
Recently published:
loader...
More recent publications...