


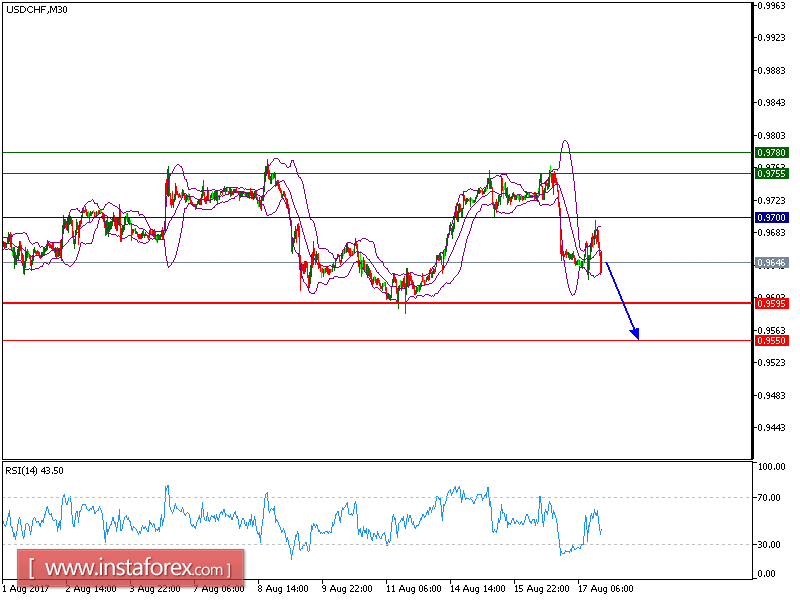
USD/CHF is under pressure and expected to trade with bearish outlook. The pair turned bearish as the prices broke below the rising trend line on August 15. The downward momentum is further reinforced by both declining 20-period and 50-period moving averages. The relative strength index shows downside momentum.
On the political front, Trump dissolved two business advisory councils after several corporate chief executives quit, causing worries over the administration's agenda of financial measures.
Meanwhile, minutes of the U.S. Federal Reserve's latest monetary policy meeting showed that policymakers appeared increasingly wary about recent weak inflation and some were hesitant to raise interest rates further.
To conclude, as long as 0.9700 holds on the upside, look for another drop to 0.9595 and even to 0.9550 in extension.
Chart Explanation: The black line shows the pivot point. The present price above the pivot point indicates the bullish position, and the price below the pivot points indicates the short position. The red lines show the support levels and the green line indicates the resistance levels. These levels can be used to enter and exit trades.
Strategy: SELL, Stop Loss: 0.9700, Take Profit: 0.9595
Resistance levels: 0.9755, 0.9780, and 0.9815
Support levels: 0.9595, 0.9550, and 0.9500


