Main Quotes Calendar Forum
flag

FX.co ★ Ichimoku indicator analysis of gold for August 18, 2017

parent
Forex Analysis:::2017-08-17T22:09:32

Ichimoku indicator analysis of gold for August 18, 2017

The Gold price remains in a short- and medium-term trend, while in a process of turning longer-term trend to bullish too. The price has broken an important long-term trend line resistance coming from its all time highs. This resistance gave many rejections in the past. Not now.

Ichimoku indicator analysis of gold for August 18, 2017

Short-term support is at $1,277 and resistance at $1,292. The tenkan-sen is breaking above the Kijun-sen. This is a bullish sign so we should expect Gold to continue higher above $1,300 over the coming weeks.

Ichimoku indicator analysis of gold for August 18, 2017

Black line -long-term resistance

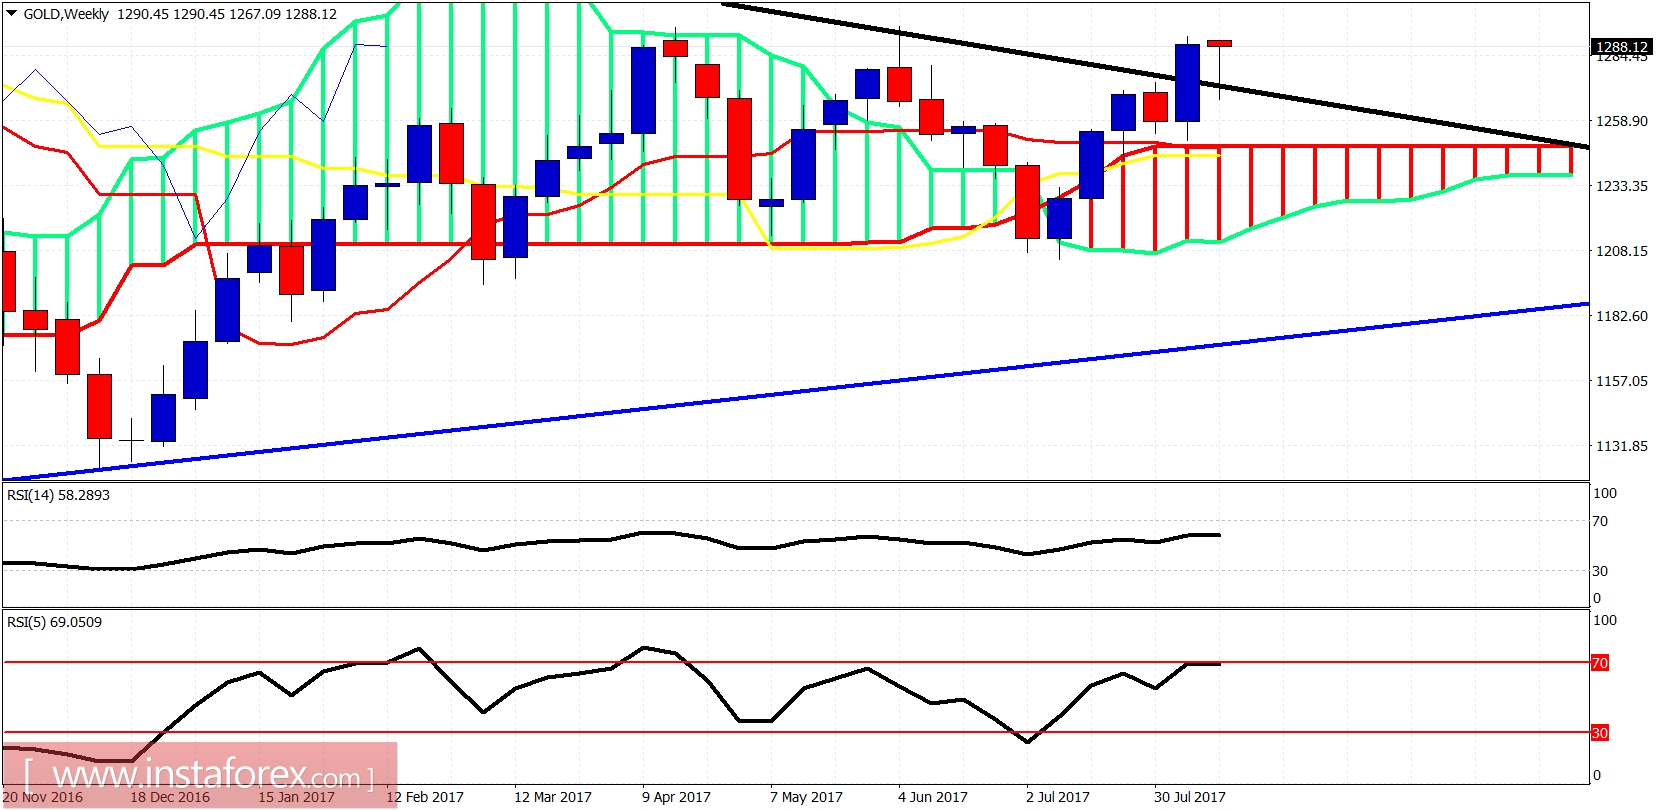
Blue line- long-term support

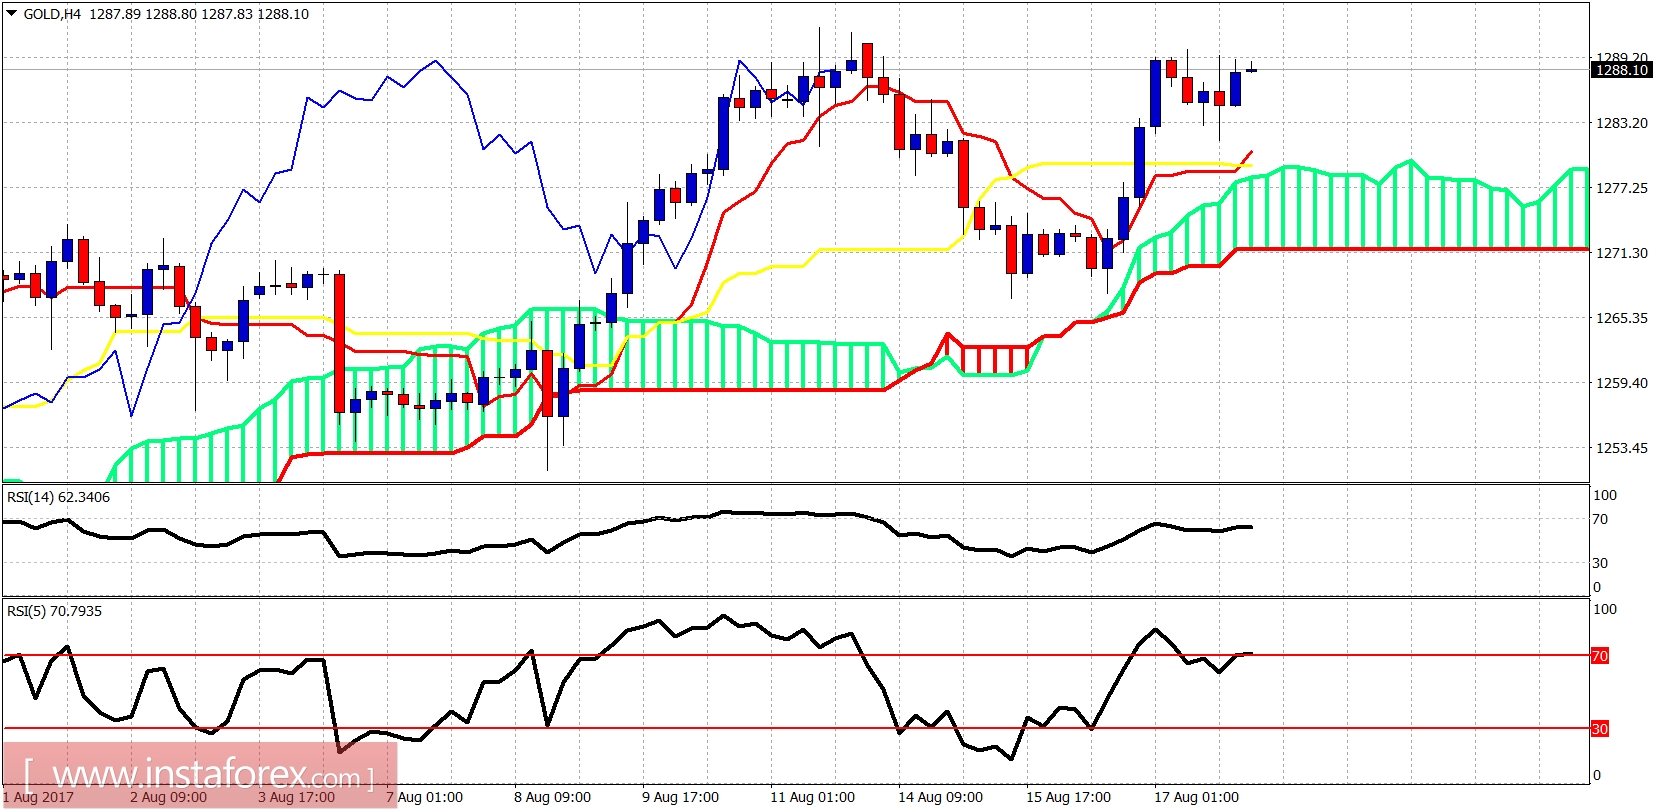
This week's candle provided a back test of the break out of the black trend line resistance. Breaking this trend line is a very important bullish signal. Many times before price got rejected and was sold off when touching the trend line. Not this time. This time we confirm our longer-term bullish view in Gold.

Analyst InstaForex
Share this article:
parent
loader...
all-was_read__icon
You have watched all the best publications
presently.
We are already looking for something interesting for you...
all-was_read__star
Recently published:
loader...
More recent publications...