


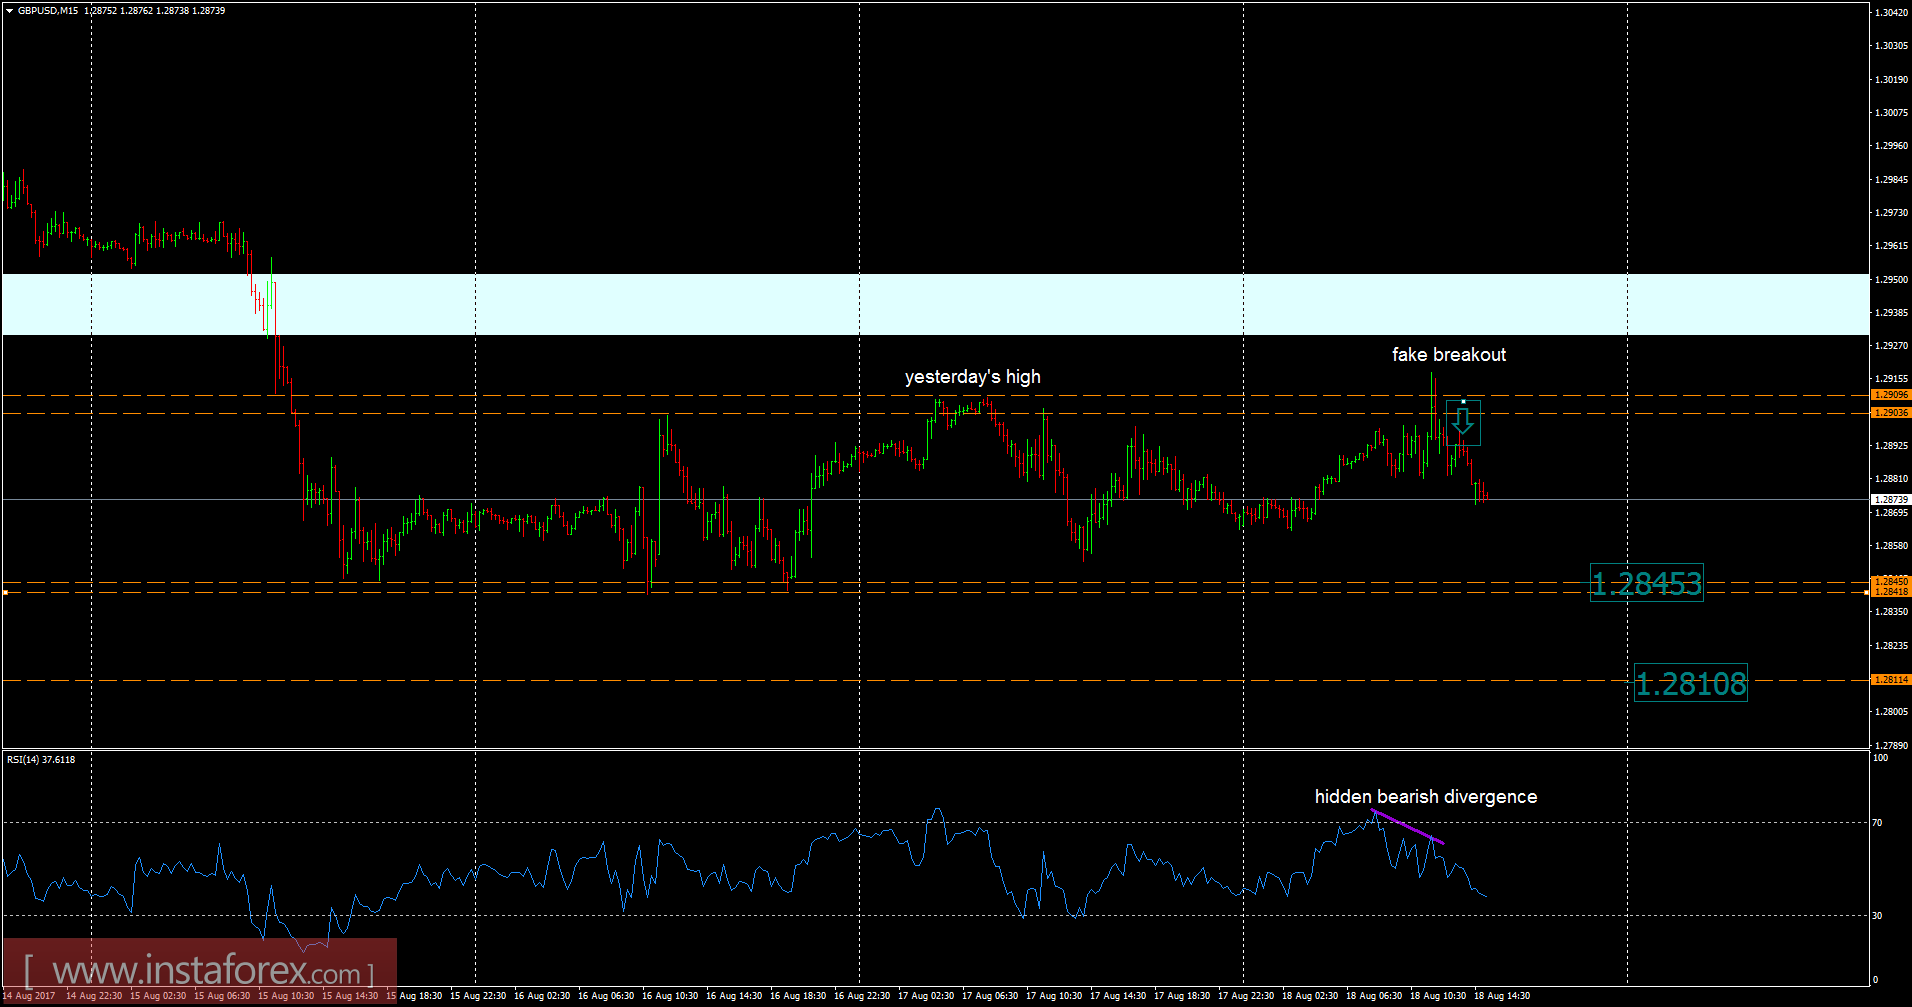
Recently, the GBP/USD pair has been trading sideways at the price of 1.2875. Anyway, according to the 15M time frame, I found a fake breakout of resistance cluster and yesterday's high at 1.2910, which is a sign that buyers got trapped and sellers took control. The RSI oscilator showed a hidden bearish divergence, which is another sign that sellers are in control. My advice is to watch for potential selling opportuntiies. The downwards targets are set at 1.2845 and 1.2810.
Resistance levels:
R1: 1.2905
R2: 1.2940
R3: 1.2970
Support levels:
S1: 1.2845
S2: 1.2815
S3: 1.2780
Trading recommendations for today: watch for potential selling opportunities.


