


The index recovered from Monday's low and it's challenging now the 200 SMA at H1 chart. The structure remains in sideways and there is no a clear path to follow in the short-term, other than a breakout of the range. If we witness a break above 93.72, further gains are expected to take place towards 94.11.
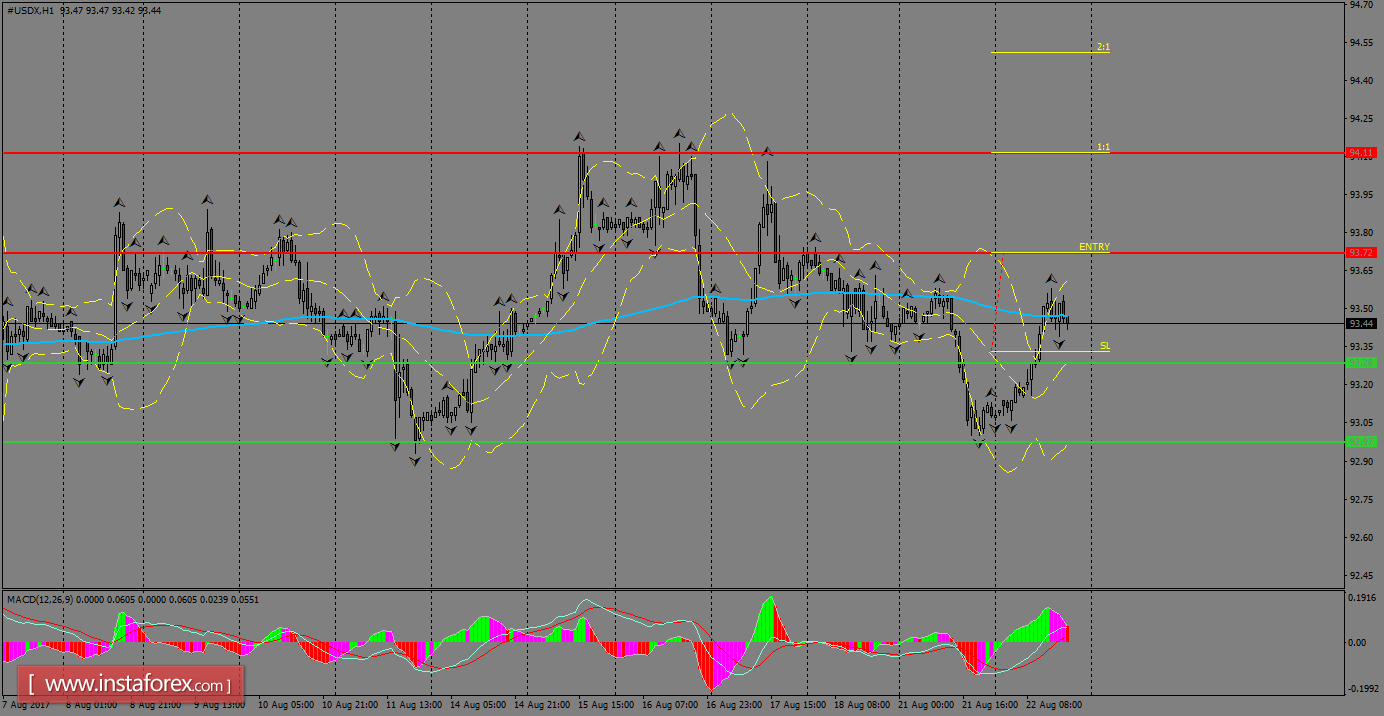
H1 chart's resistance levels: 93.72 / 94.11
H1 chart's support levels: 93.28 / 92.97
Trading recommendations for today: Based on the H1 chart, place buy (long) orders only if the USD Index breaks with a bullish candlestick; the resistance level is at 93.72, take profit is at 94.11 and stop loss is at 93.33.


