


The index remains trapped in a range since several days ago and the 200 SMA in the H1 chart is providing a pivot point. The bulls are trying to gather momentum for a key breakout around 93.72 in order to extend gains towards 94.11. To the downside, if we witness a consolidation below 93.28, another leg lower could be seen and it could test the 93.97 zone.
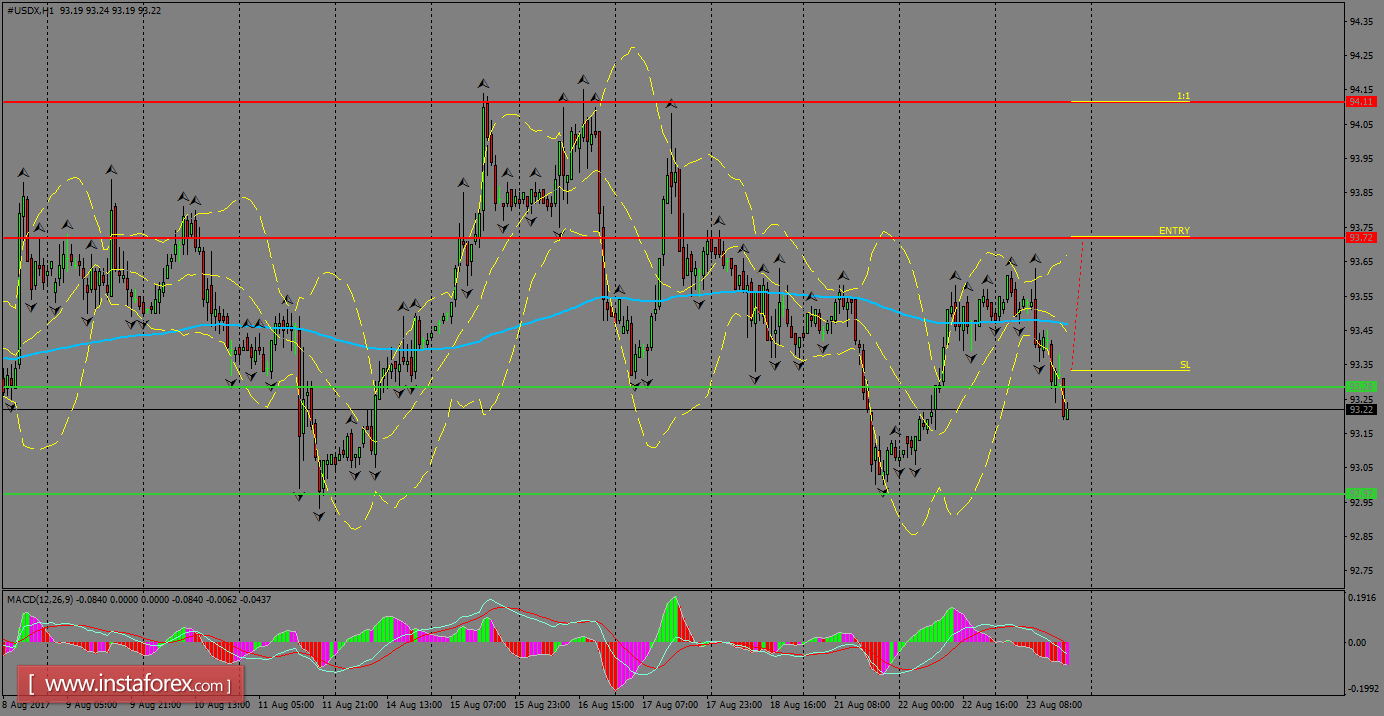
H1 chart's resistance levels: 93.72 / 94.11
H1 chart's support levels: 93.28 / 92.97
Trading recommendations for today: Based on the H1 chart, place buy (long) orders only if the USD Index breaks with a bullish candlestick; the resistance level is at 93.72, take profit is at 94.11 and stop loss is at 93.33.


