


Gold remains in a bullish trend. Price is moving sideways in the short-term but above the support line. Breaking above $1,295 will open the way for a move towards $1,320-40.
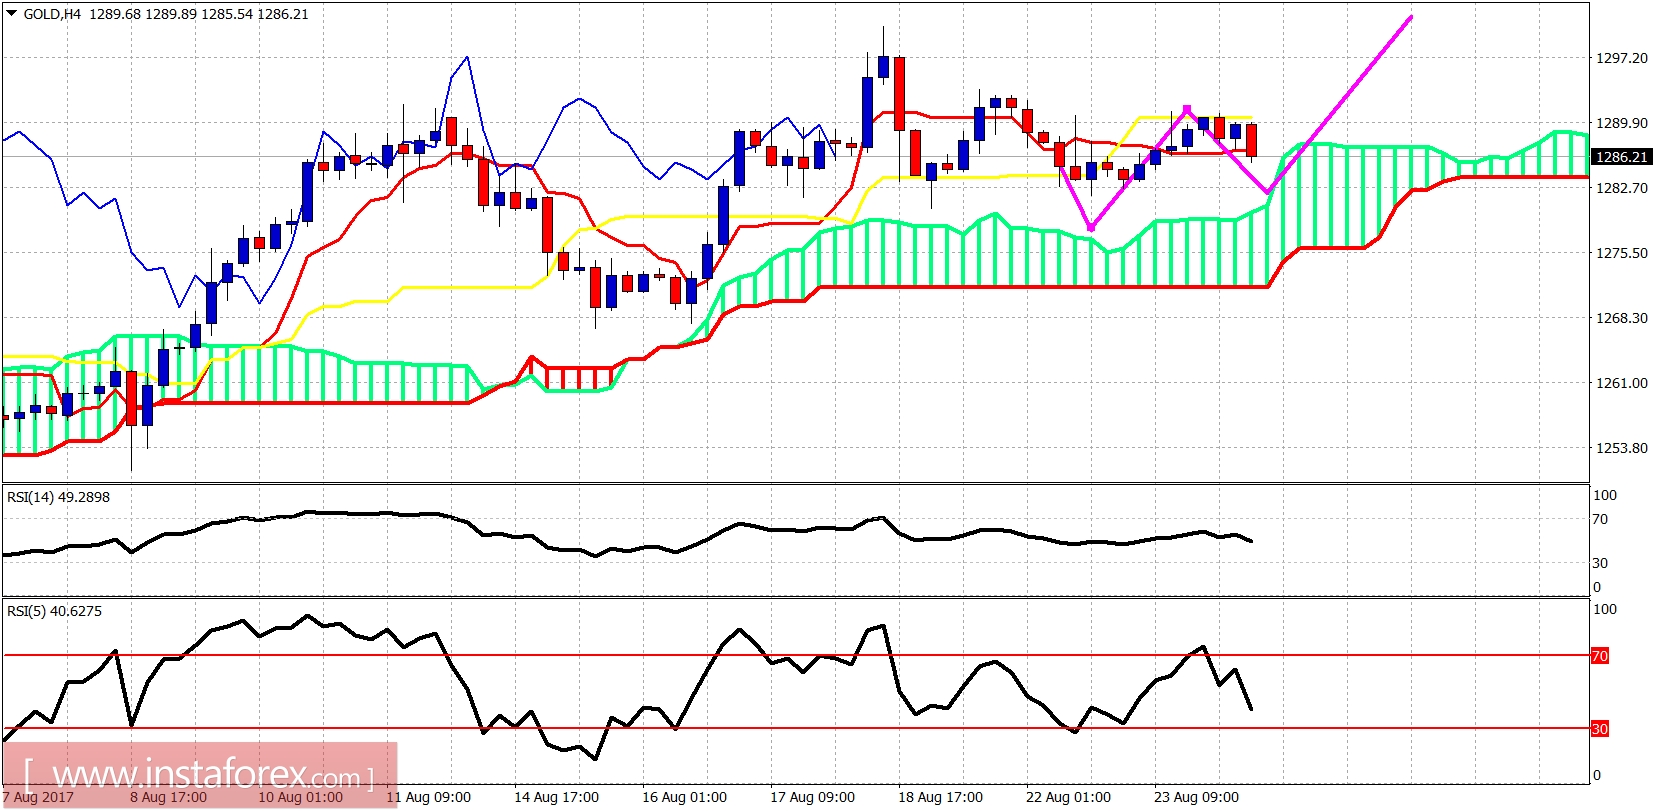
Gold could push towards the 4-hour Kumo (cloud). There we should expect to see a bounce to new highs. The trend remains bullish. The support is at $1,282 and the next one is expected at $1,277. The resistance is found at $1,293 and the next one lies at $1,295.
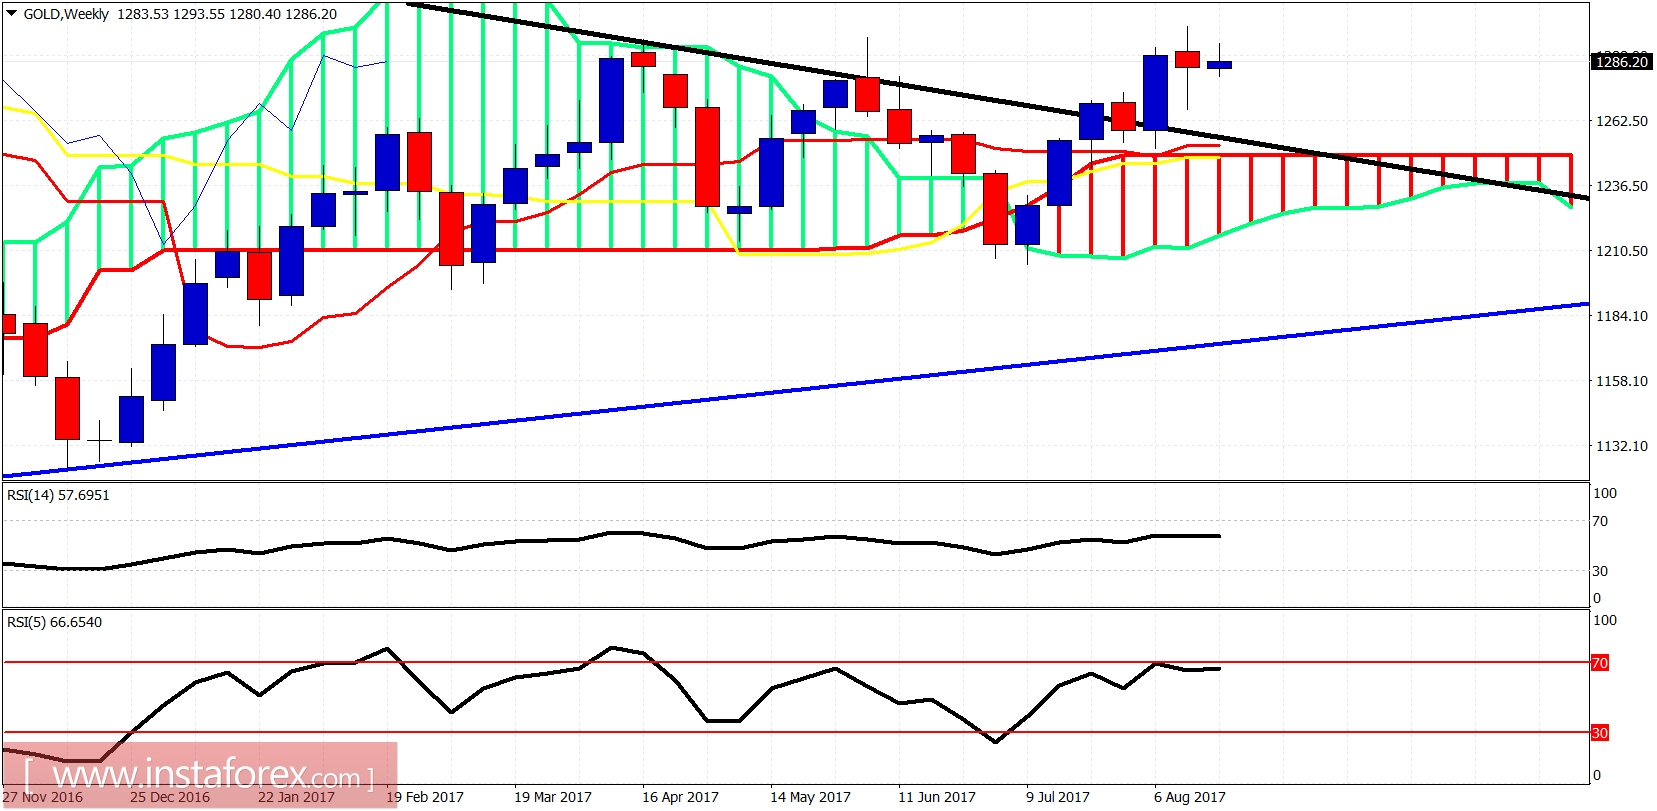
Blue line - long-term support
Gold is in a bullish medium-term trend. The price is above the weekly Kumo and has broken above the long-term trend line resistance. Even if the price pulls back towards $1,250, this would be a gift for bulls. I expect the bullish trend in gold to continue for the rest of the year at least.


