


USDX stays in sideways across the board and looks like it can remain in the same path ahead of Jackson Hole's event. The support zone of 93.28 is still providing a solid barrier for sellers and if that level gives up, we might expect bearish continuation towards 92.97. To the upside, the pair remains contained by the 93.72 level.
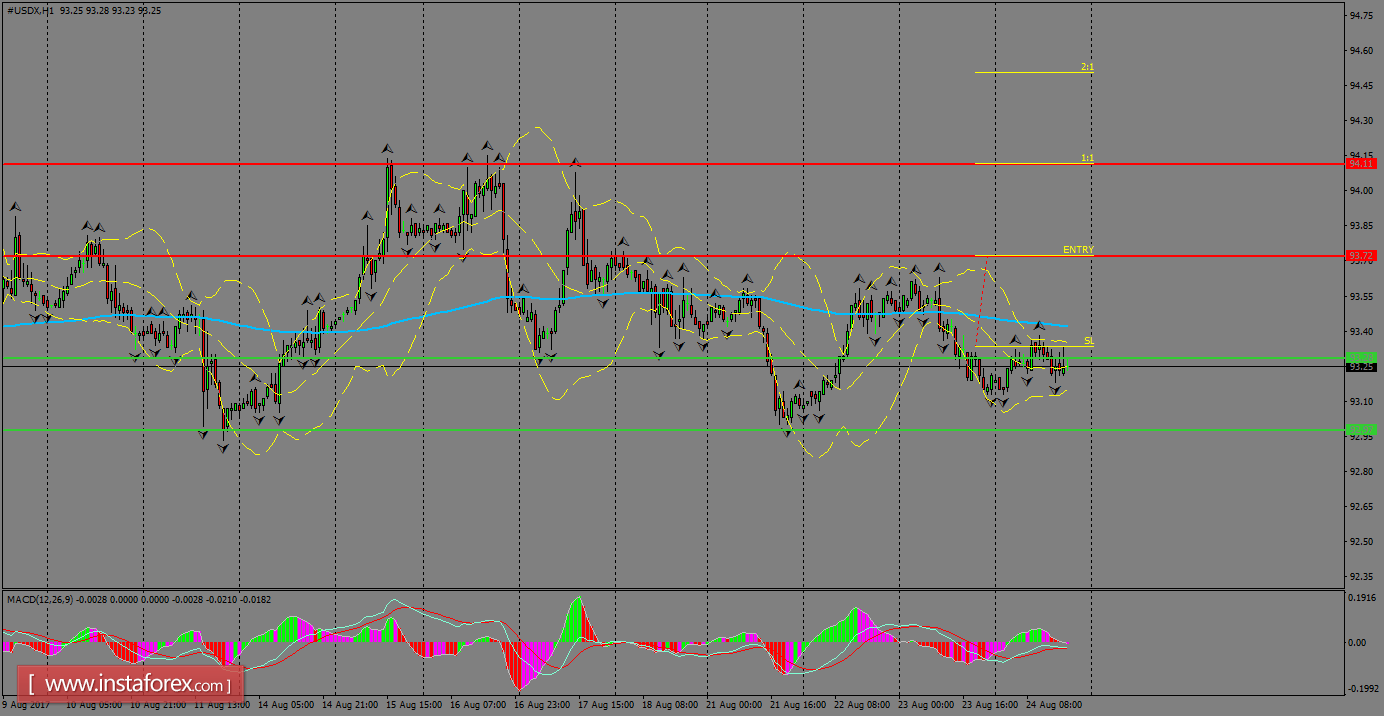
H1 chart's resistance levels: 93.72 / 94.11
H1 chart's support levels: 93.28 / 92.97
Trading recommendations for today: Based on the H1 chart, place buy (long) orders only if the USD Index breaks with a bullish candlestick; the resistance level is at 93.72, take profit is at 94.11 and stop loss is at 93.33.


