


Jackson Hole's event helped to add pressure on the US Dollar and currently is trading below the 93.00 handle. After several days trapped in a range, the index looks like it's riding a nice bearish consolidation below the 200 SMA at H1 chart. If we witness a breakout below 92.51, we can expect further weakness towards the 92.09 level.
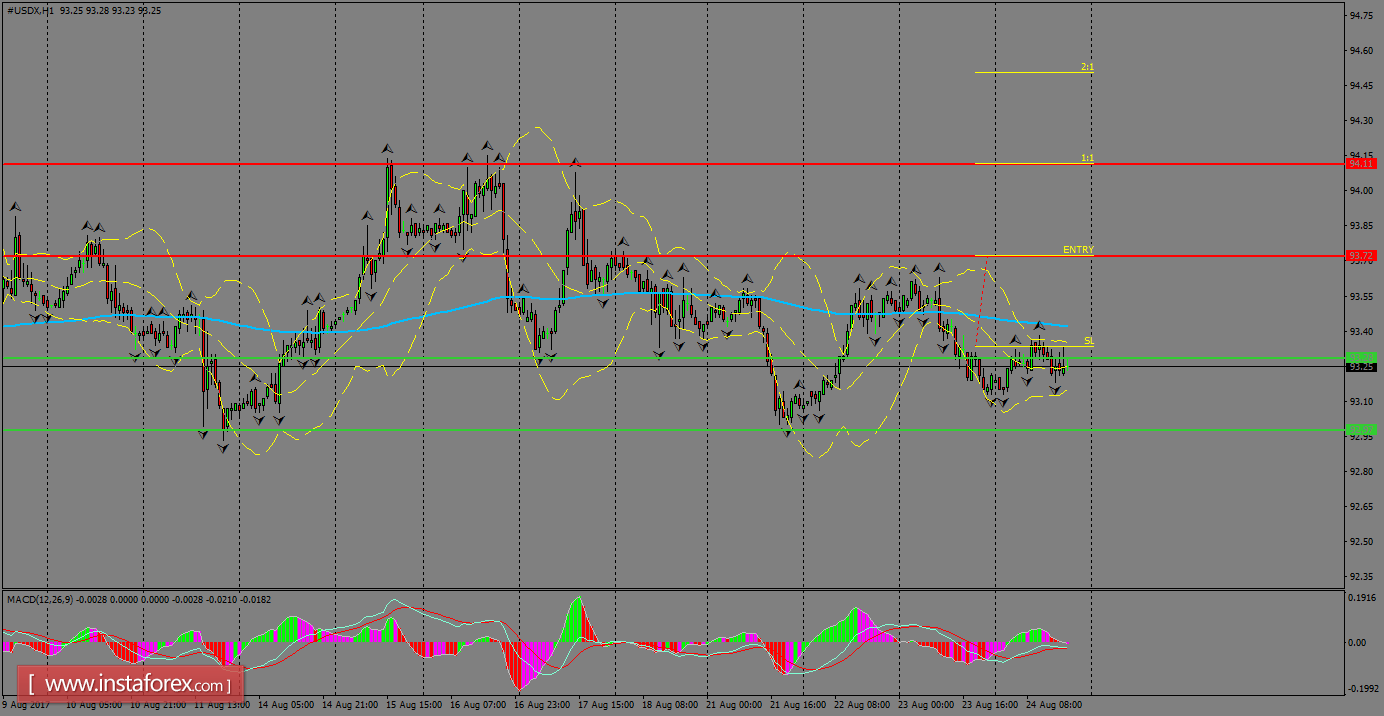
H1 chart's resistance levels: 93.09 / 93.72
H1 chart's support levels: 92.51 / 92.09
Trading recommendations for today: Based on the H1 chart, place sell (short) orders only if the USD Index breaks with a bearish candlestick; the support level is at 92.51, take profit is at 92.09 and stop loss is at 92.91.


