


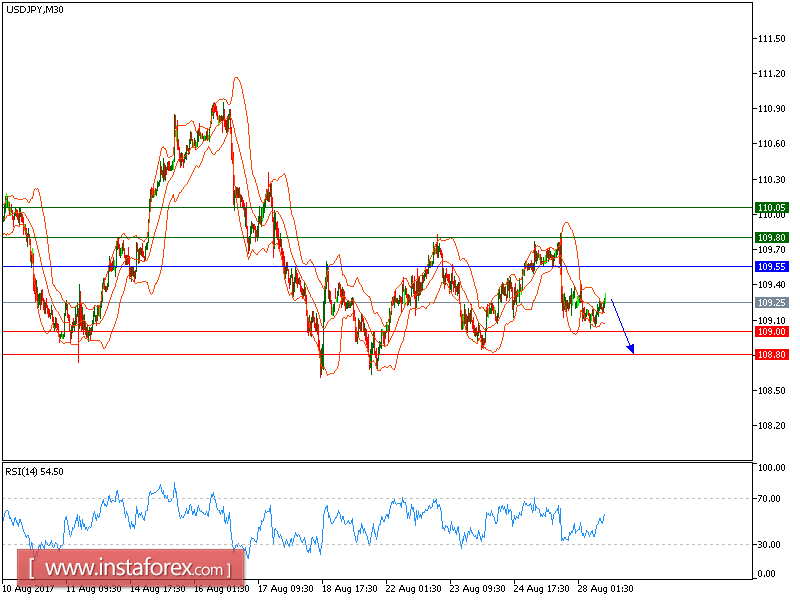
USD/JPY is under pressure and expected to continue the downside movement. The pair broke below its 20-period and 50-period moving averages, which play resistance roles. The relative strength index is mixed with a bearish bias. The upside potential should be limited by the key resistance at 109.55.
Hence, as long as this key level is not surpassed, look for a further decline to 109.00 and even to 108.80 (the low of August 24) in extension.
Alternatively, if the price moves in the opposite direction, a long position is recommended above 109.55 with a target at 109.80.
Chart Explanation: The black line shows the pivot point. The current price above the pivot point indicates a bullish position, while the price below the pivot point is a signal for a short position. The red lines show the support levels and the green line indicates the resistance level. These levels can be used to enter and exit trades.
Strategy: SELL, Stop Loss: 109.55, Take Profit: 109.00
Resistance levels: 109.80, 110.05, and 110.55
Support Levels: 109.00, 108.80, 108.60


