


USDX remains strong in the bearish bias across the board and it's now forming a lower low pattern that opens the doors for further weakness. To the downside, if the index manages to break below Monday's lows, it can plummet towards the 92.09 level. The 200 SMA is still providing the path for the short-term and is calling for more downside.
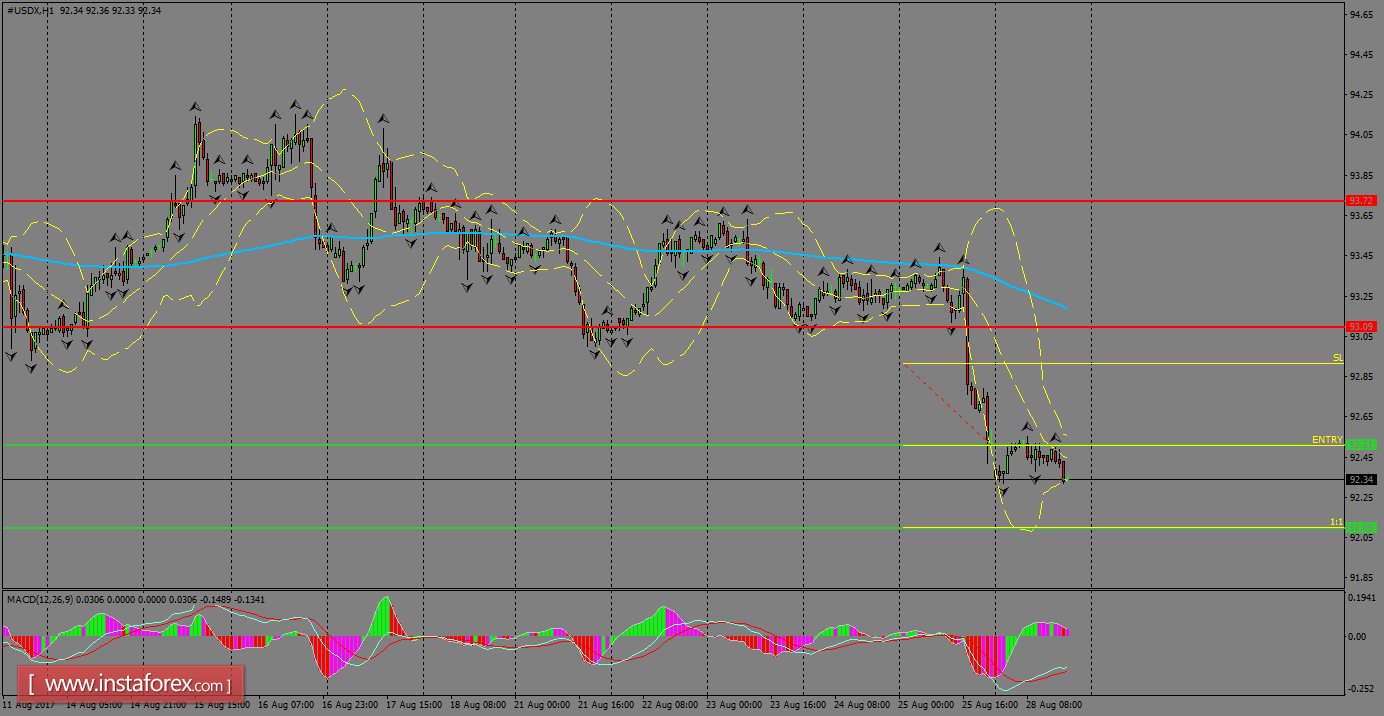
H1 chart's resistance levels: 93.09 / 93.72
H1 chart's support levels: 92.51 / 92.09
Trading recommendations for today: Based on the H1 chart, place sell (short) orders only if the USD Index breaks with a bearish candlestick; the support level is at 92.51, take profit is at 92.09 and stop loss is at 92.91.


