Main Quotes Calendar Forum
flag

FX.co ★ Ichimoku indicator analysis of gold for August 29, 2017

parent
Forex Analysis:::2017-08-29T07:32:01

Ichimoku indicator analysis of gold for August 29, 2017

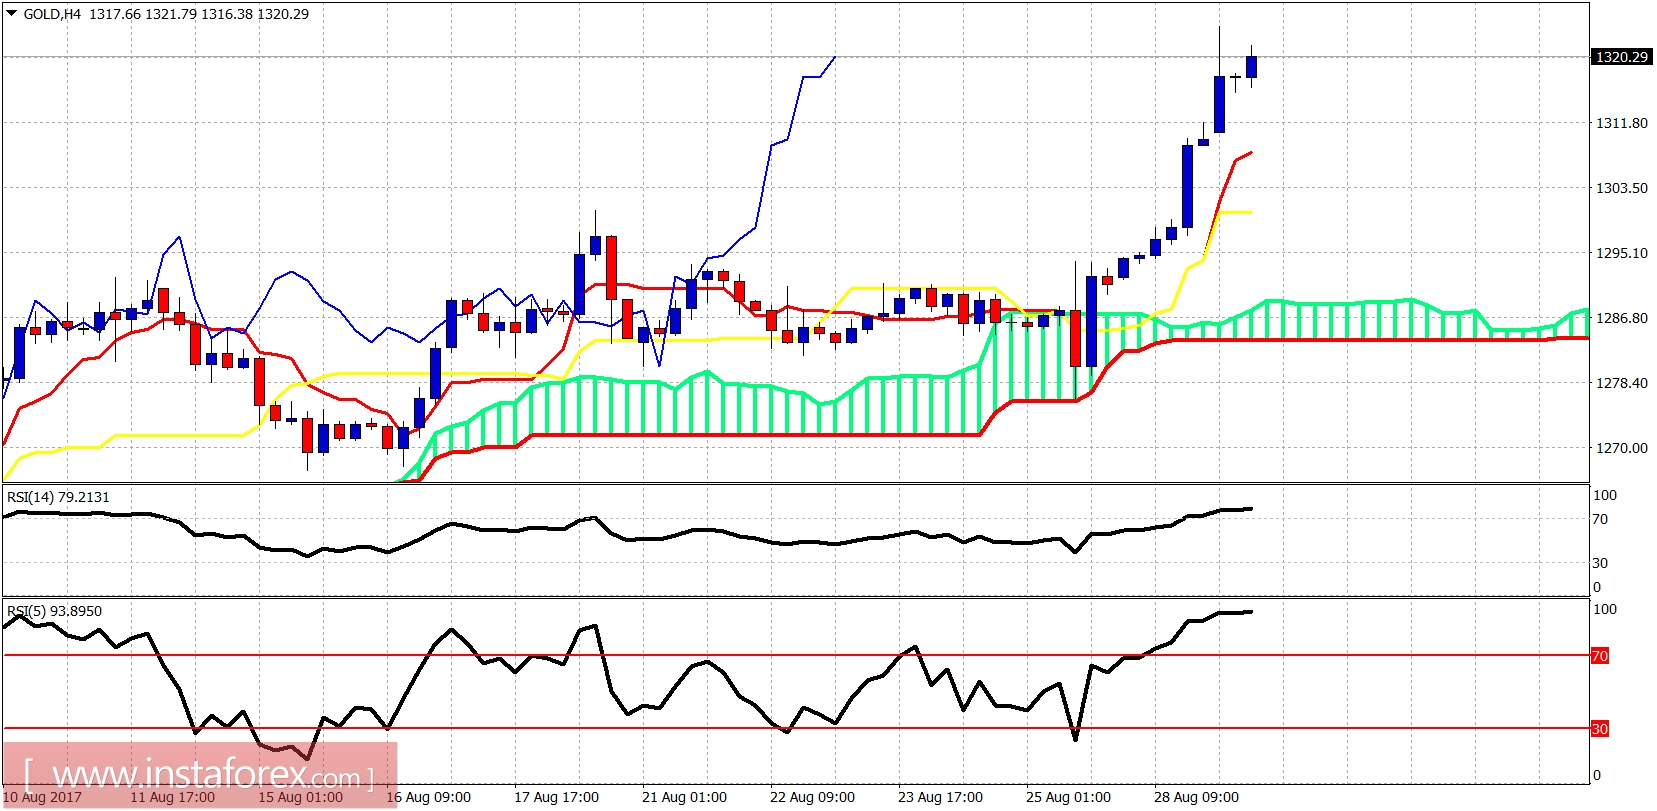
The Gold price has reached our $1,320 which was our first target. The trend remains bullish. Gold could reverse from current levels to back test $1,300 or even $1,280 but overall we remain long-term bullish.

Ichimoku indicator analysis of gold for August 29, 2017

The price is above both tenkan- and kijun-sen indicators. The trend is clearly bullish. Short-term support is at $1,310, next at $1,300 and next at $1,288. Resistance is at $1,350 now.

Ichimoku indicator analysis of gold for August 29, 2017

Purple line - resistance

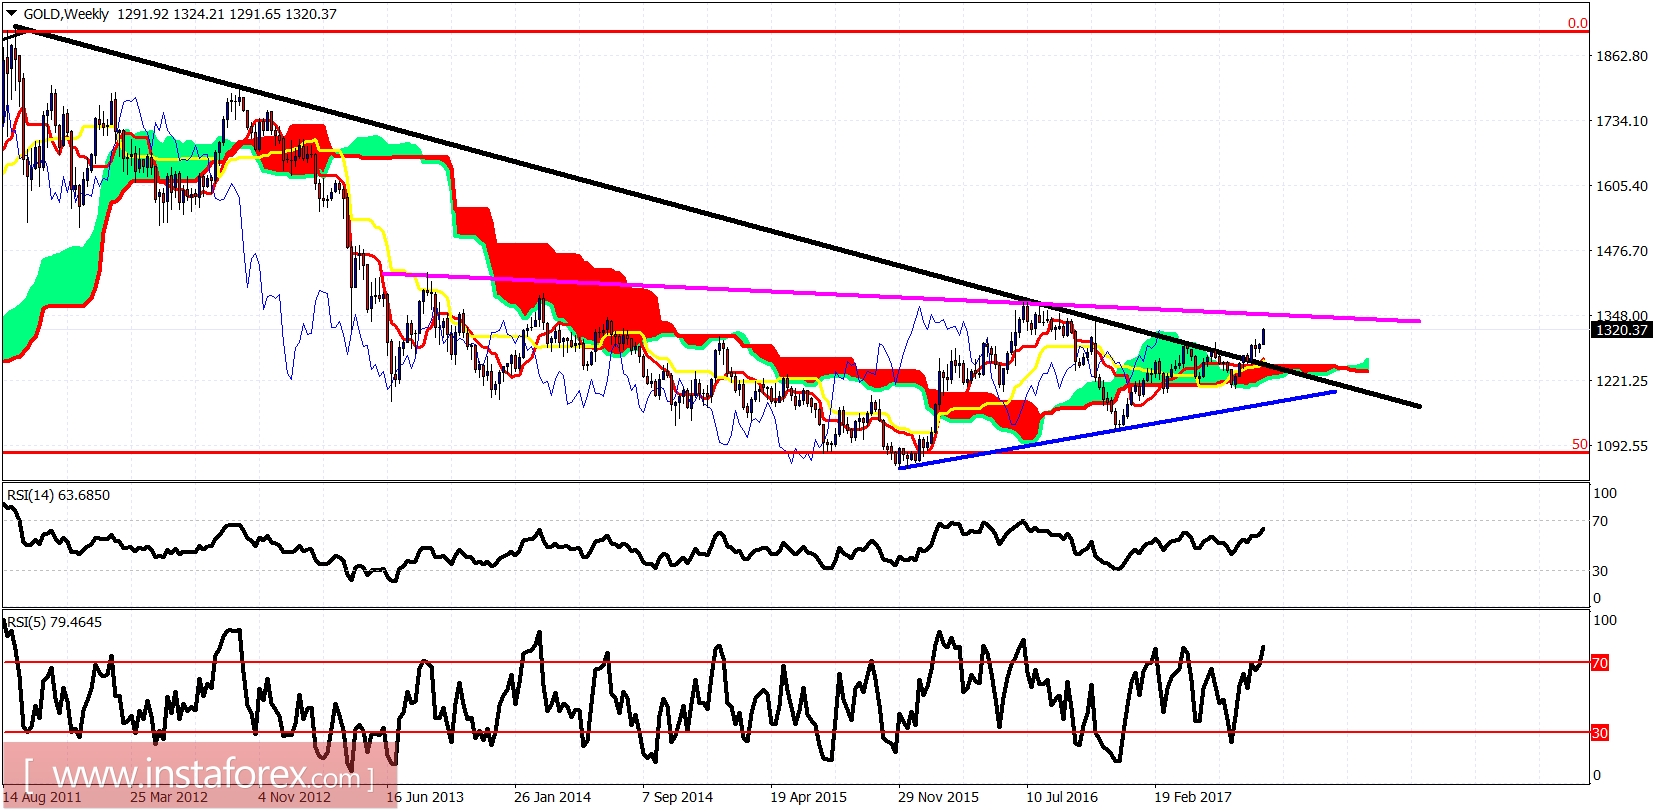
Black line - long-term resistance

Blue line -long-term support

The Gold price has broken above the weekly Kumo (cloud) and above the long-term black trend line resistance from its all time highs. The trend is bullish. The price is heading now towards $1,350 where the next resistance trend line is found.

Analyst InstaForex
Share this article:
parent
loader...
all-was_read__icon
You have watched all the best publications
presently.
We are already looking for something interesting for you...
all-was_read__star
Recently published:
loader...
More recent publications...