


GBP/USD has entered into a corrective phase, erasing Tuesday's gains and it remains supported by the 200 SMA at H1 chart. If the pair manages to do a rebound over there, we can expect a breakout of Tuesday's highs, opening the doors to test the resistance zone of 1.3013. To the downside, the main idea remains in place. Once it breaks below the 200 SMA, the next target should be the 1.2761 level.
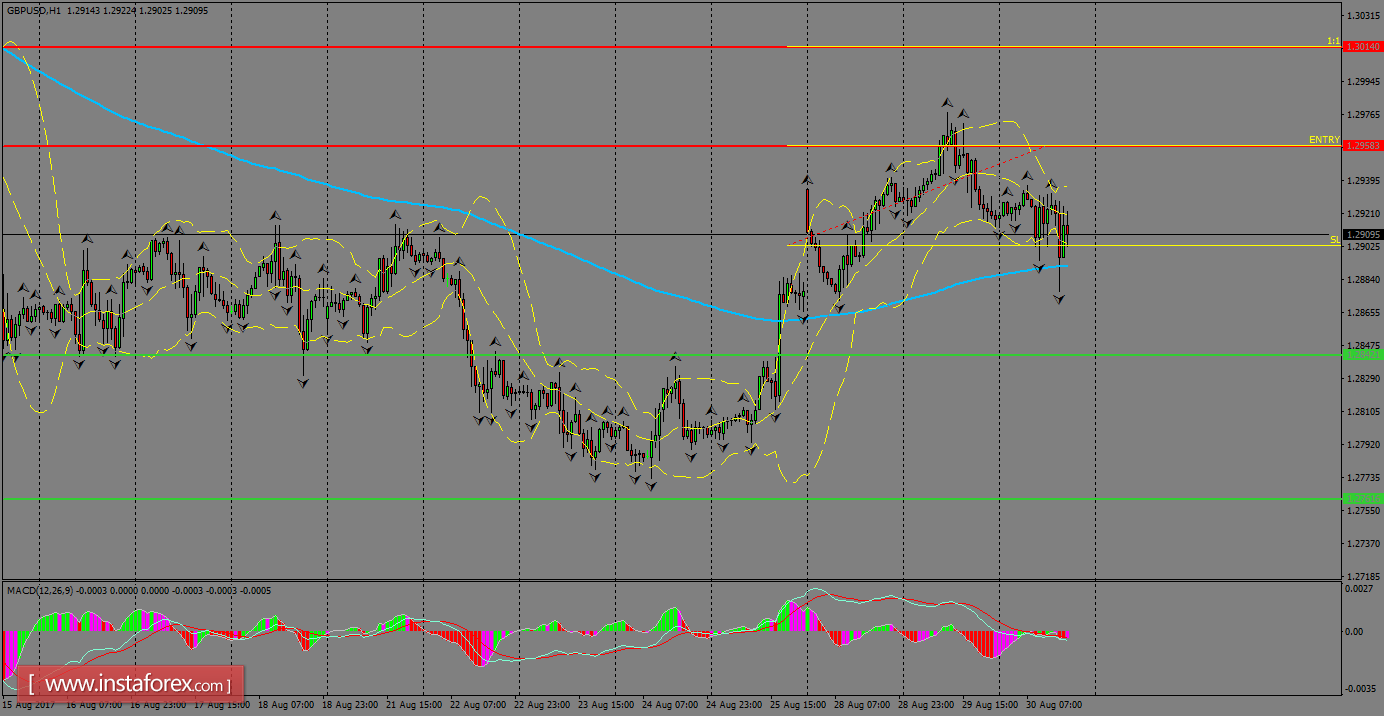
H1 chart's resistance levels: 1.2958 / 1.3013
H1 chart's support levels: 1.2842 / 1.2761
Trading recommendations for today: Based on the H1 chart, buy (long) orders only if the GBP/USD pair breaks a bullish candlestick; the resistance level is at 1.2958, take profit is at 1.3013 and stop loss is at 1.2903.


