


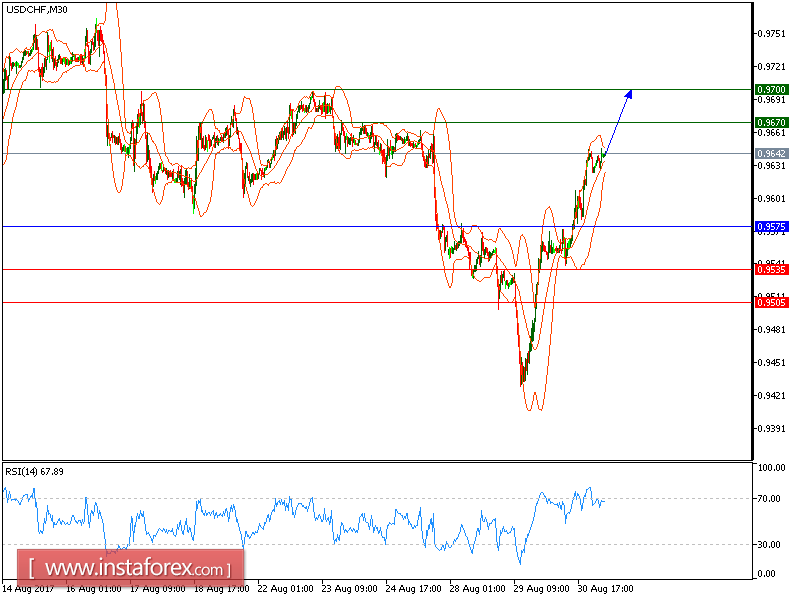
USD/CHF is expected to continue its upside movement. The technical picture of the pair is positive as the prices recorded higher tops and higher bottoms. The relative strength index is bullish and calls for a further upside.
The U.S. Commerce Department reported that GDP grew at a 3.0% annual rate in the second quarter, higher than +2.6% estimated previously and the strongest growth since the first quarter of 2015.
Besides, payroll processor Automatic Data Processing (ADP) reported that the U.S. private sector added 237,000 jobs in August (vs. +185,000 jobs expected), the biggest monthly increase in five months.
To conclude, as long as 0.9575 is not broken, look for a new challenge to 0.9670 and even to 0.9700 in extension.
Chart Explanation: The black line shows the pivot point. The present price above the pivot point indicates the bullish position, and the price below the pivot points indicates the short position. The red lines show the support levels and the green line indicates the resistance levels. These levels can be used to enter and exit trades.
Strategy: BUY, Stop Loss: 0.9575, Take Profit: 0.9670
Resistance levels: 0.9670, 0.9700, and 0.9745
Support levels: 0.9535, 0.9505, and 0.9475


