Main Quotes Calendar Forum
flag

FX.co ★ Ichimoku indicator analysis of USDX for August 31, 2017

parent
Forex Analysis:::2017-08-31T07:11:53

Ichimoku indicator analysis of USDX for August 31, 2017

The Dollar index has broken through the short-term resistance at 92.50 and as expected is heading towards 93-93.30. Short-term trend is still bearish and this bounce is considered just a correction and not a bigger reversal to the upside.

Ichimoku indicator analysis of USDX for August 31, 2017

The Dollar index is trading above both the tenkan- and kijun-sen indicators but below the 4-hour Kumo. As long as price is below 93.70, trend is bearish in Ichimoku terms. Resistance is at 93.30. Also at 93.20 we have the 78.6% Fibonacci retracement resistance. Support is at 92.55.

Ichimoku indicator analysis of USDX for August 31, 2017

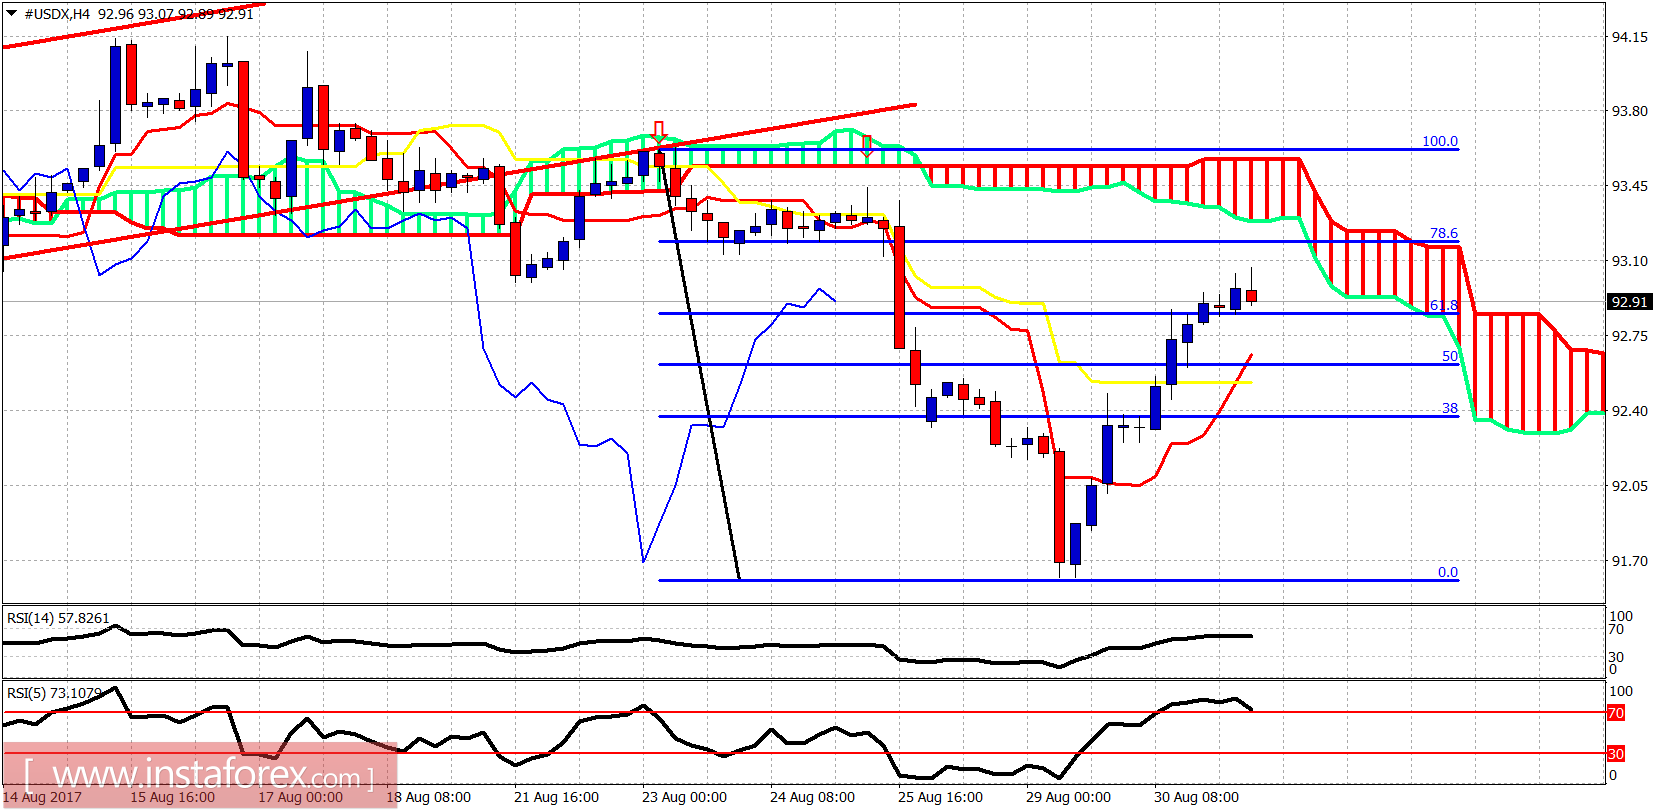
Red lines - bearish channel

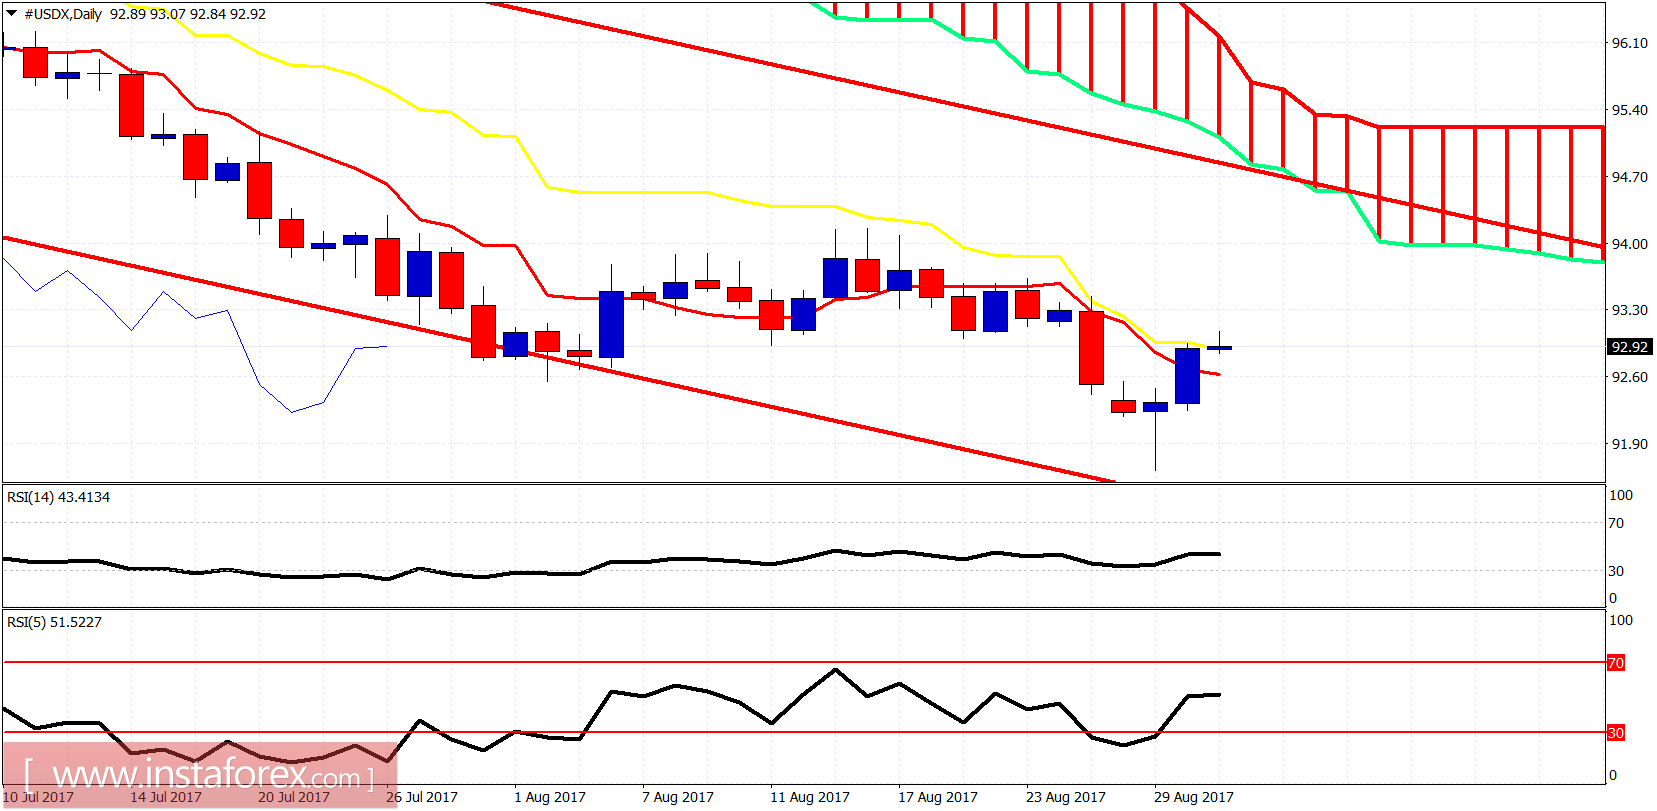
On the daily basis, price remains inside the bearish channel well below the daily Kumo (cloud). Price is trying to break above the daily kijun-sen (yellow line indicator). A rejection here is very possible. This would imply new lows ahead below 91.62. However a move above the kijun-sen will open the way for a bigger bounce towards channel and Kumo resistance at 94.

Analyst InstaForex
Share this article:
parent
loader...
all-was_read__icon
You have watched all the best publications
presently.
We are already looking for something interesting for you...
all-was_read__star
Recently published:
loader...
More recent publications...