


Technical outlook:
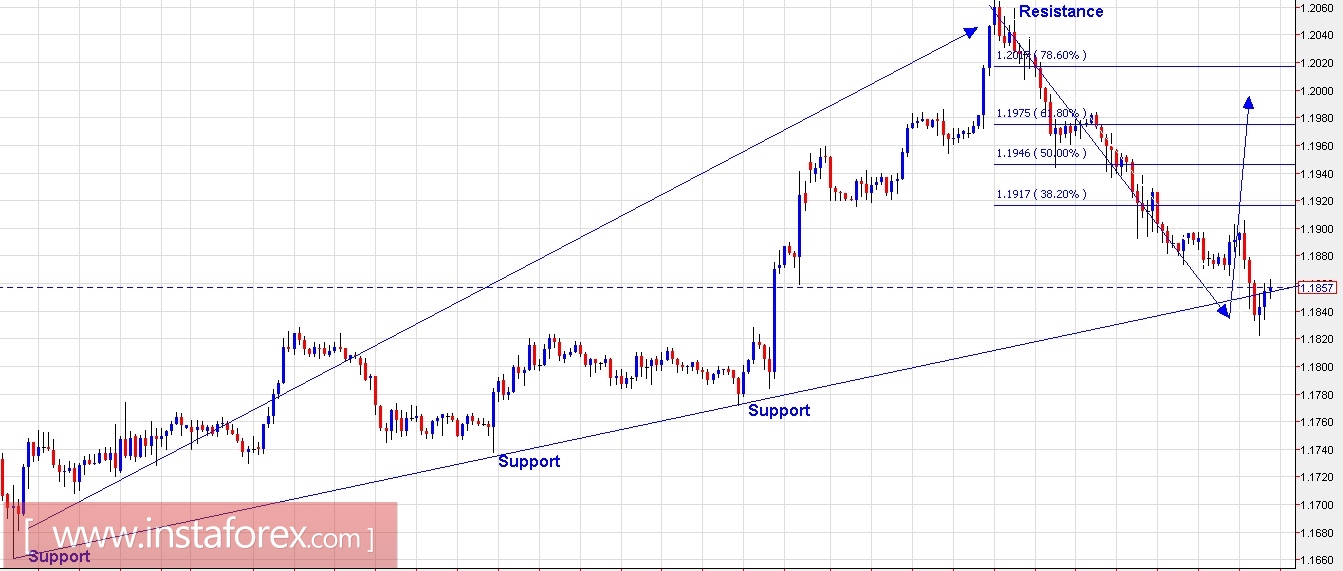
The EUR/USD pair is testing a trend line support on the hourly chart as seen here. We remain optimistic about a major top in place at 1.2070 levels yesterday, but a temporary bullish bounce maybe expected now. As shown here, the fibonacci 0.618 resistance is seen at 1.1980 levels, and a counter trend rally now would face resistance. Looking at the wave count of the drop from 1.2070 through 1.1820/30 levels, a 5-wave impulse can be seen (not labelled here). Keeping this fact in mind, the overall strategy could be to sell on rallies but a counter trend rally is expected from this point. We shall again take a review at 1.1980 levels, to decide whether EUR/USD is turning lower, or the rally is extending itself. Intermediate support is seen at 1.1780 levels, while resistance is at 1.1920 levels respectively.
Trading plan:
Long-term traders may want to remain short as discussed earlier with stop above 1.2070 levels. Short-term traders might want to go long with stop below 1.1820, targeting 1.1980 levels then reverse.
GBPUSD chart setups:
Technical outlook:
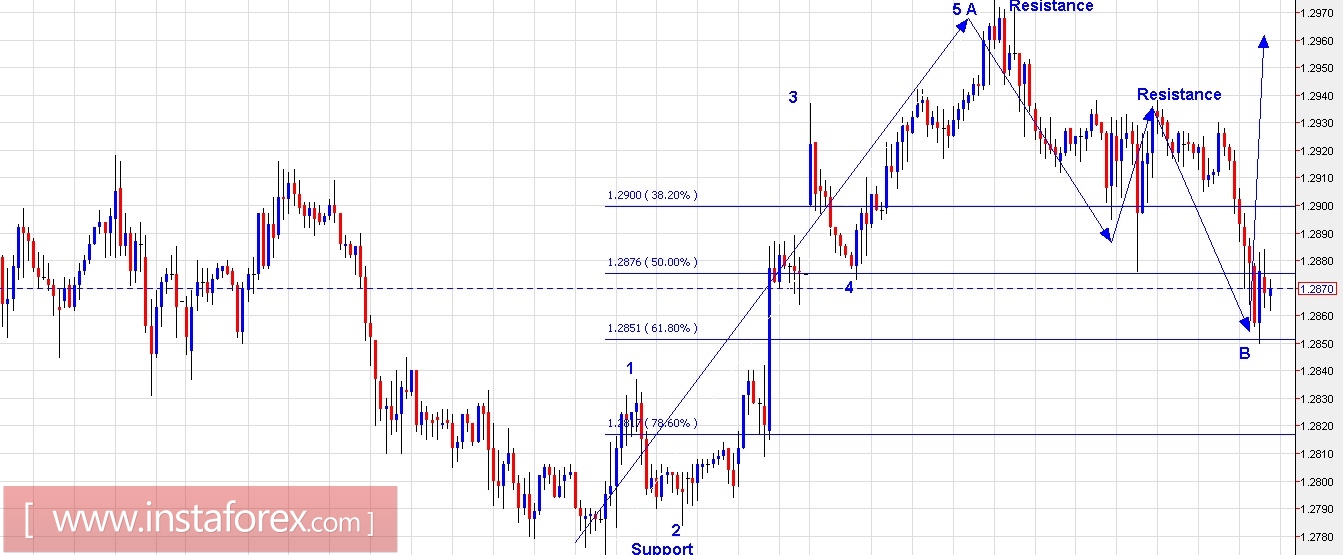
The GBP/USD chart is providing clear wave counts on the hourly chart as depicted here. The pair is broadly into a counter trend rally A-B-C, which is expected to extend higher and terminate into 1.3050/75 levels. At present, the pair is looking to have terminated wave B at 1.2850 levels, which is also fibonacci 0.618 support of wave A. Furthermore, we can see an engulfing bullish candlestick pattern being produced right after testing 1.2850 levels. These convergences strongly indicate a possibility of a bullish reversal from current levels and push through 1.3050 levels at least. On the flip side, a break below 1.2770 levels would indicate that GBP/USD is pushing lower towards 1.2600 and lower. Immediate support is seen at 1.2770 levels while resistance is at 1.2930 levels respectively.
Trading plan:
Please remain long from here, stop below 1.2800 levels, target 1.3050/70
Fundamental outlook:
There are no major events left for the rest of the day.
Good luck!


