


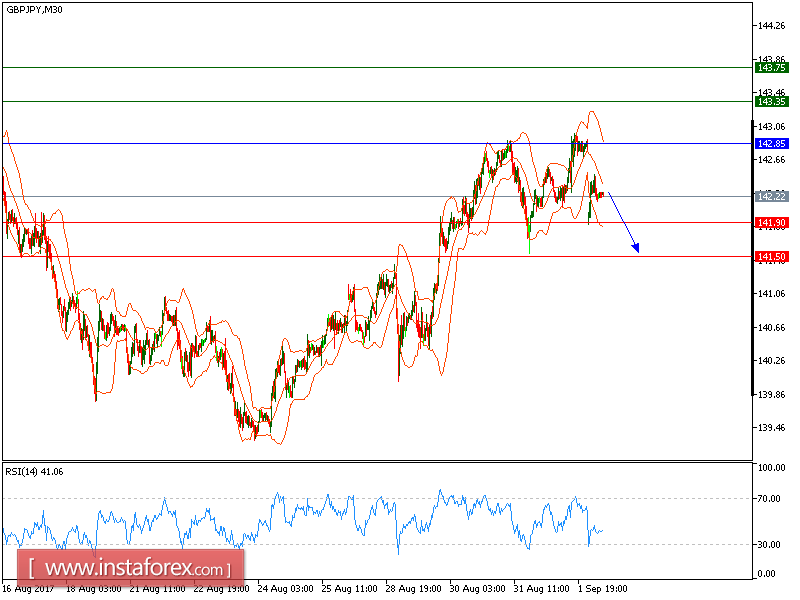
GBP/JPY is under pressure and expected to trade with a bearish outlook. The pair remains capped by its falling 20-period and 50-period moving averages and is likely to post a further decline. The nearest key resistance at 142.85 maintains the strong selling pressure on the prices. Besides, the relative strength index is negative below its neutrality area at 50.
Therefore, as long as 142.85 is not surpassed, look for a new pullback to 141.90 and 141.50 in extension.
Alternatively, if the price moves in the direction opposite to the forecast, a long position is recommended below 142.85 with the target at 143.35.
Strategy: SELL, Stop Loss: 142.85, Take Profit: 141.90.
Chart Explanation: the black line shows the pivot point. The price above the pivot point indicates the bullish position; and when it is below the pivot points, it indicates a short position. The red lines show the support levels and the green line indicates the resistance levels. These levels can be used to enter and exit trades.
Resistance levels: 143.35, 143.75, and 144.35
Support levels: 141.90, 141.50, and 141.00


