


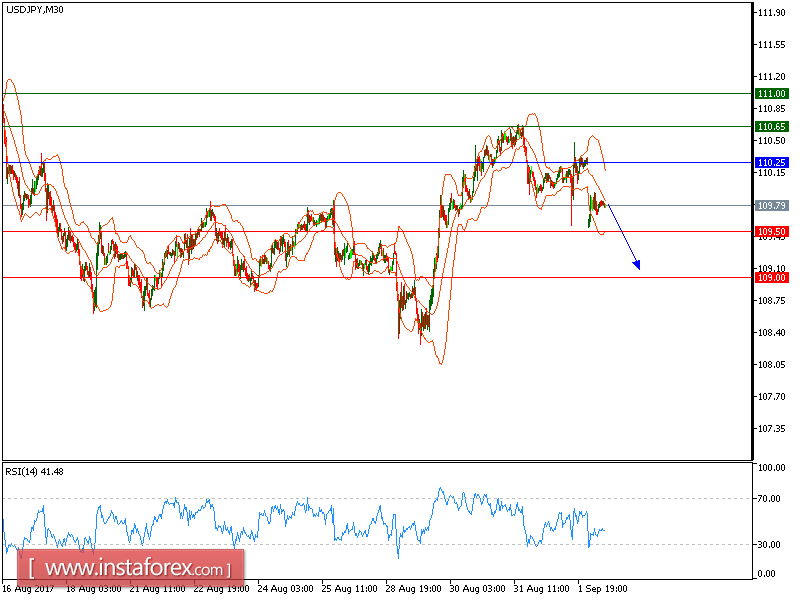
USD/JPY is expected to trade with a bearish outlook. The pair posted a gap down open and broke below its lower boundary of Bollinger Bands, which indicated an acceleration of the bearish trend. The 20-period moving average is turning down. The relative strength index is heading downward.
Hence, as long as 110.25 is not surpassed, look for a further decline to 109.50 and even to 109.00 in extension.
Alternatively, if the price moves in the opposite direction, a long position is recommended above 110.25 with a target at 109.50.
Chart Explanation: The black line shows the pivot point. The current price above the pivot point indicates a bullish position, while the price below the pivot point is a signal for a short position. The red lines show the support levels and the green line indicates the resistance level. These levels can be used to enter and exit trades.
Strategy: SELL, Stop Loss: 110.25, Take Profit: 109.50
Resistance levels: 110.65, 111.00, and 111.50
Support Levels: 109.50, 109.00, 108.45


