Main Quotes Calendar Forum
flag

FX.co ★ Ichimoku indicator analysis of USDX for September 4, 2017

parent
Forex Analysis:::2017-09-04T07:48:50

Ichimoku indicator analysis of USDX for September 4, 2017

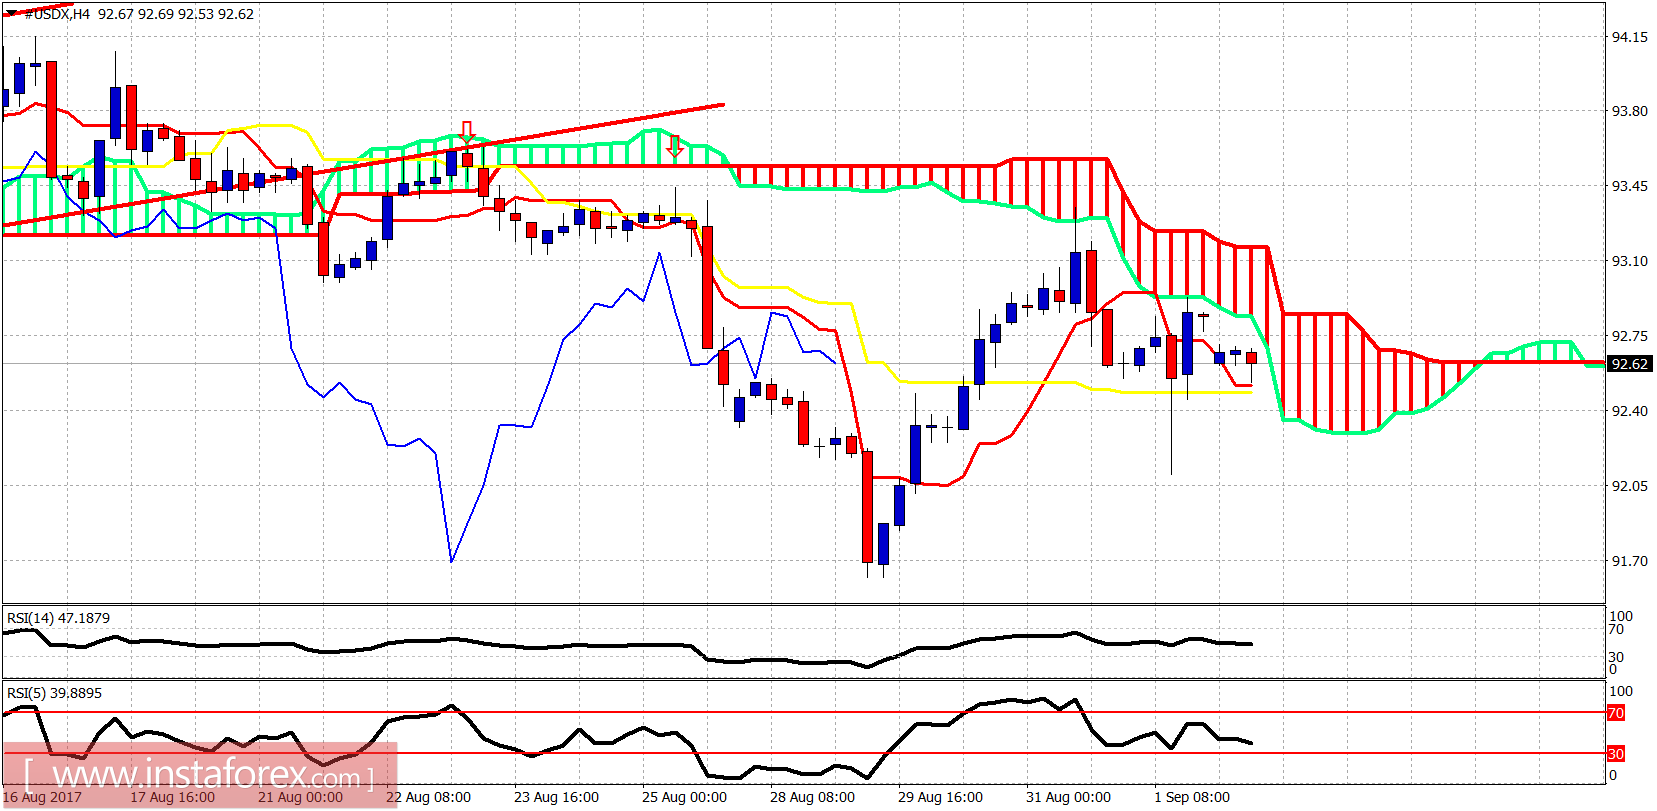
The Dollar index had a volatile Friday after the NFP announcement. Initial heavy selling pressures were faded and price bounced back to pre- NFP levels, however trend remains bearish as the index continues to trade below Ichimoku cloud resistance.

Ichimoku indicator analysis of USDX for September 4, 2017

Price is below the Kumo but above both the tenkan- and kijun-sen indicators. Trend is unclear in the very short-term time frame. Support is at 92.50. Breaking below it will open the way for a push to new lows towards 90.50-90. Resistance is at 92.80-93.10.

Ichimoku indicator analysis of USDX for September 4, 2017

Red lines - bearish channel

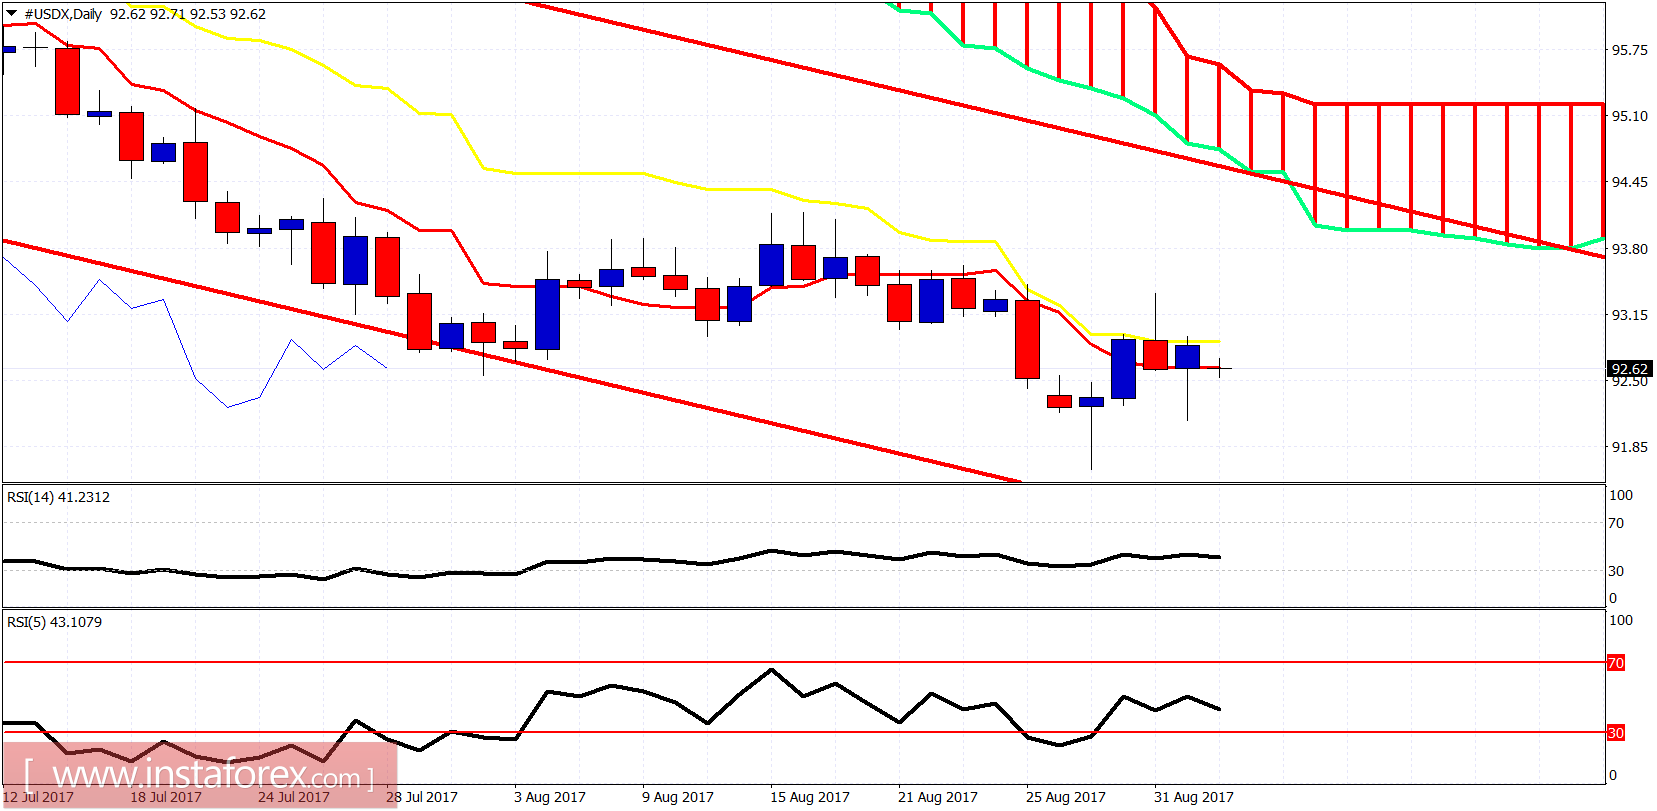
On a daily basis trend remains bearish. Price is still below the daily kijun-sen (yellow line indicator). Price is trying to hold above the daily tenkan-sen (red line indicator). A break above 93-93.10 will open the way for a bounce towards 94-94.30. A move towards the 90 level is what I expect next. But we may see 94 first. Key support is at 92.10.

Analyst InstaForex
Share this article:
parent
loader...
all-was_read__icon
You have watched all the best publications
presently.
We are already looking for something interesting for you...
all-was_read__star
Recently published:
loader...
More recent publications...