


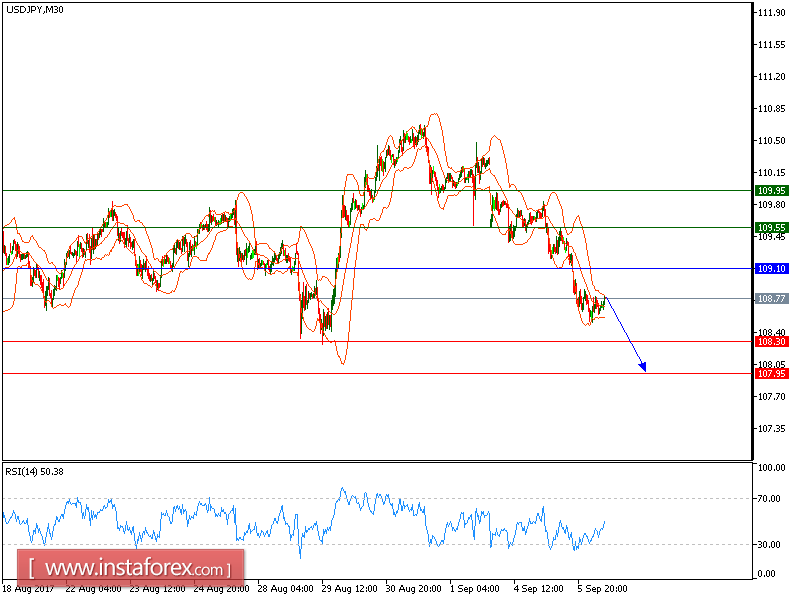
All our targets which we predicted in our previous analysis have been hit. The pair recorded lower tops and lower bottoms since September 5, which confirmed a positive outlook. The downward momentum is further reinforced by both declining 20-period and 50-period moving averages. The relative strength index lacks upward momentum.
Hence, below 109.10, look for a new test to 108.30 and even to 107.95 in extension.
Alternatively, if the price moves in the opposite direction, a long position is recommended above 109.10 with a target at 109.55.
Chart Explanation: The black line shows the pivot point. The current price above the pivot point indicates a bullish position, while the price below the pivot point is a signal for a short position. The red lines show the support levels and the green line indicates the resistance level. These levels can be used to enter and exit trades.
Strategy: SELL, Stop Loss: 110.25, Take Profit: 109.50
Resistance levels: 109.55, 109.95, and 110.35
Support Levels: 108.30, 107.95, 107.50


