


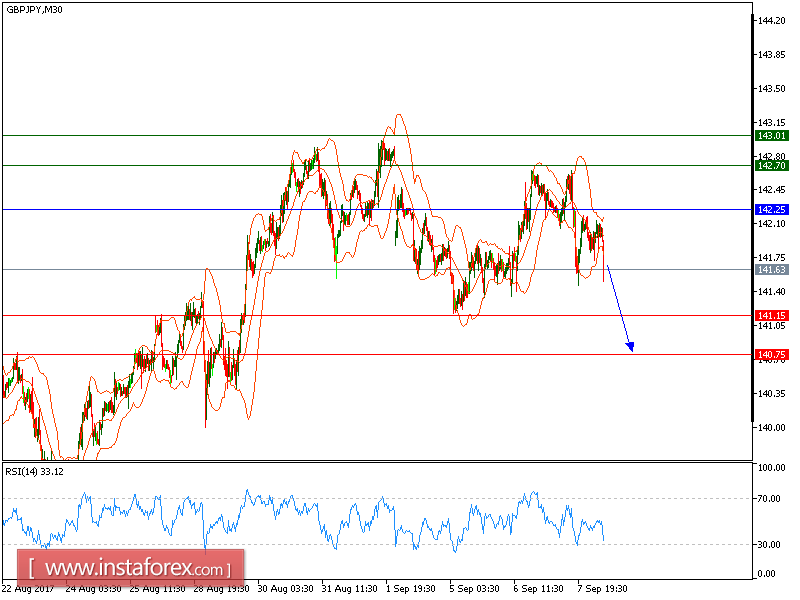
GBP/JPY is under pressure and expected to continue its downside movement. The pair formed an intraday "V-top" pattern last night and is clearly turning down. The nearest key resistance at 142.25 maintains the strong selling pressure on the prices. In addition, the 20-period moving average is about to cross below the 50-period one (a negative signal).
Therefore, as long as 142.25 is not surpassed, likely decline to 141.15 & 140.75 in extension.
Alternatively, if the price moves in the direction opposite to the forecast, a long position is recommended above 142.25 with the target at 142.70.
Strategy: SELL, Stop Loss: 142.25, Take Profit: 141.15.
Chart Explanation: the black line shows the pivot point. The price above the pivot point indicates the bullish position; and when it is below the pivot points, it indicates a short position. The red lines show the support levels and the green line indicates the resistance levels. These levels can be used to enter and exit trades.
Resistance levels: 142.70, 143.00, and 143.75
Support levels: 141.15, 140.75, and 140.00


