Main Quotes Calendar Forum
flag

FX.co ★ Ichimoku indicator analysis of gold for September 12, 2017

parent
Forex Analysis:::2017-09-12T07:17:47

Ichimoku indicator analysis of gold for September 12, 2017

Gold price has reached the Kumo (cloud) support on the 4-hour chart. This support area is expected to hold and provide a new upward move in Gold prices to new highs. I'm buying pull backs in Gold.

Ichimoku indicator analysis of gold for September 12, 2017

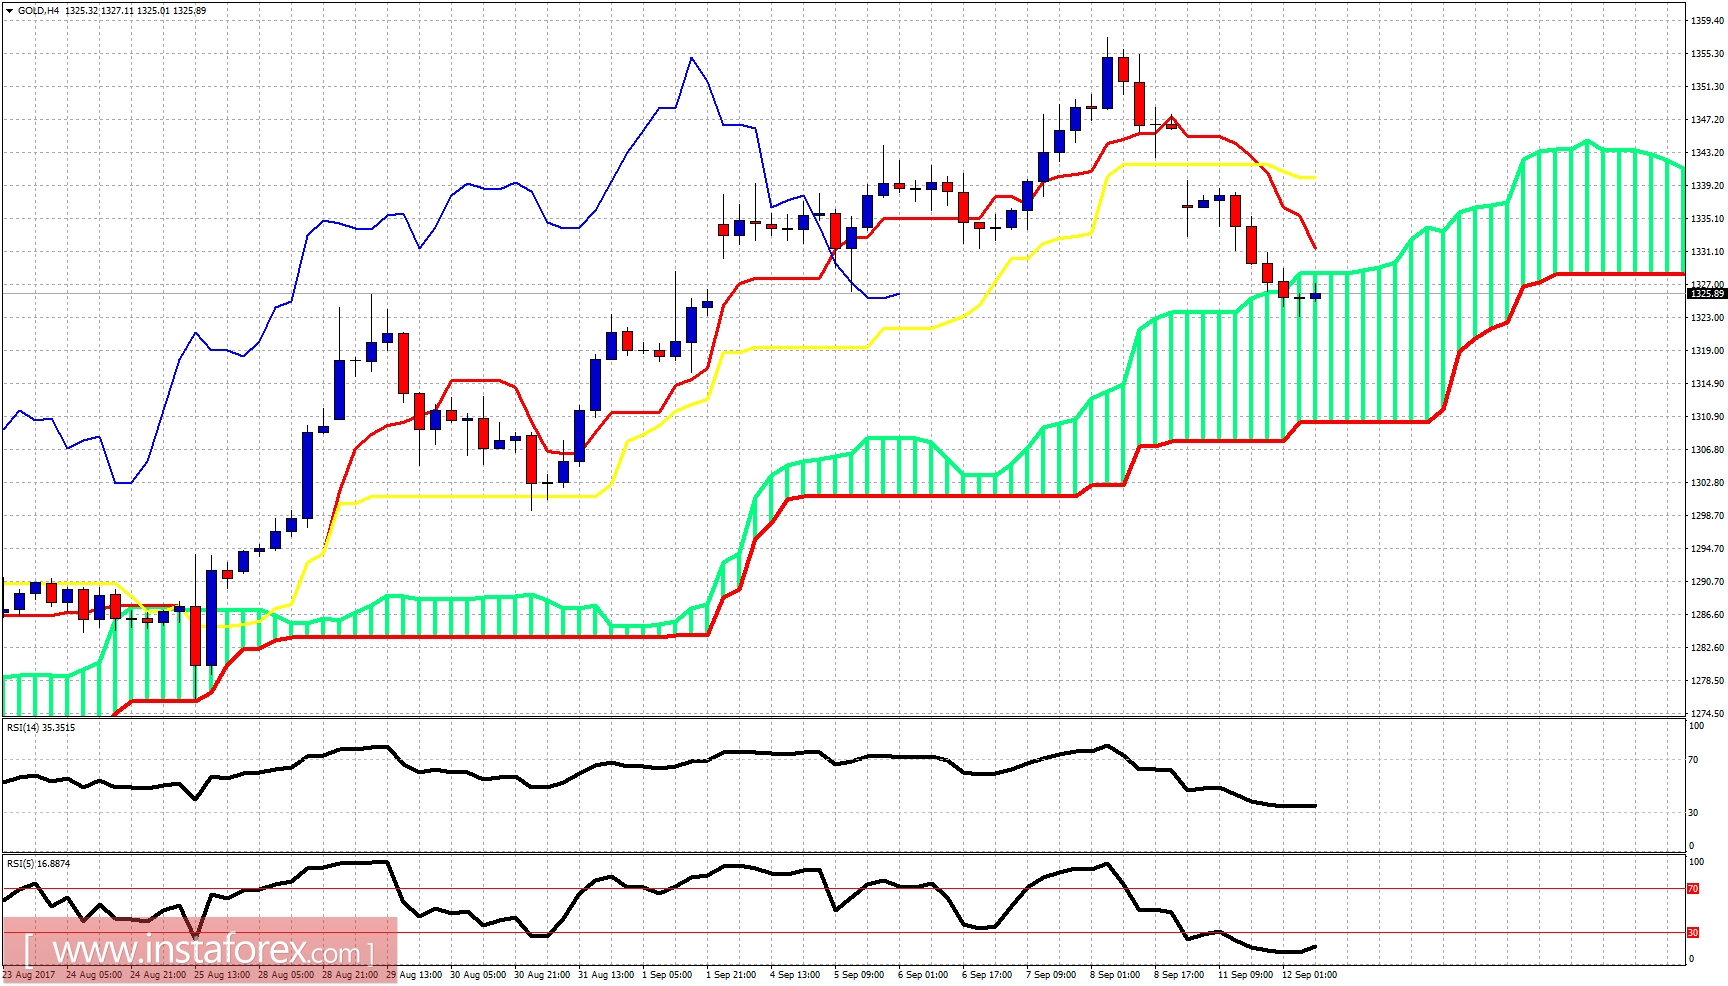
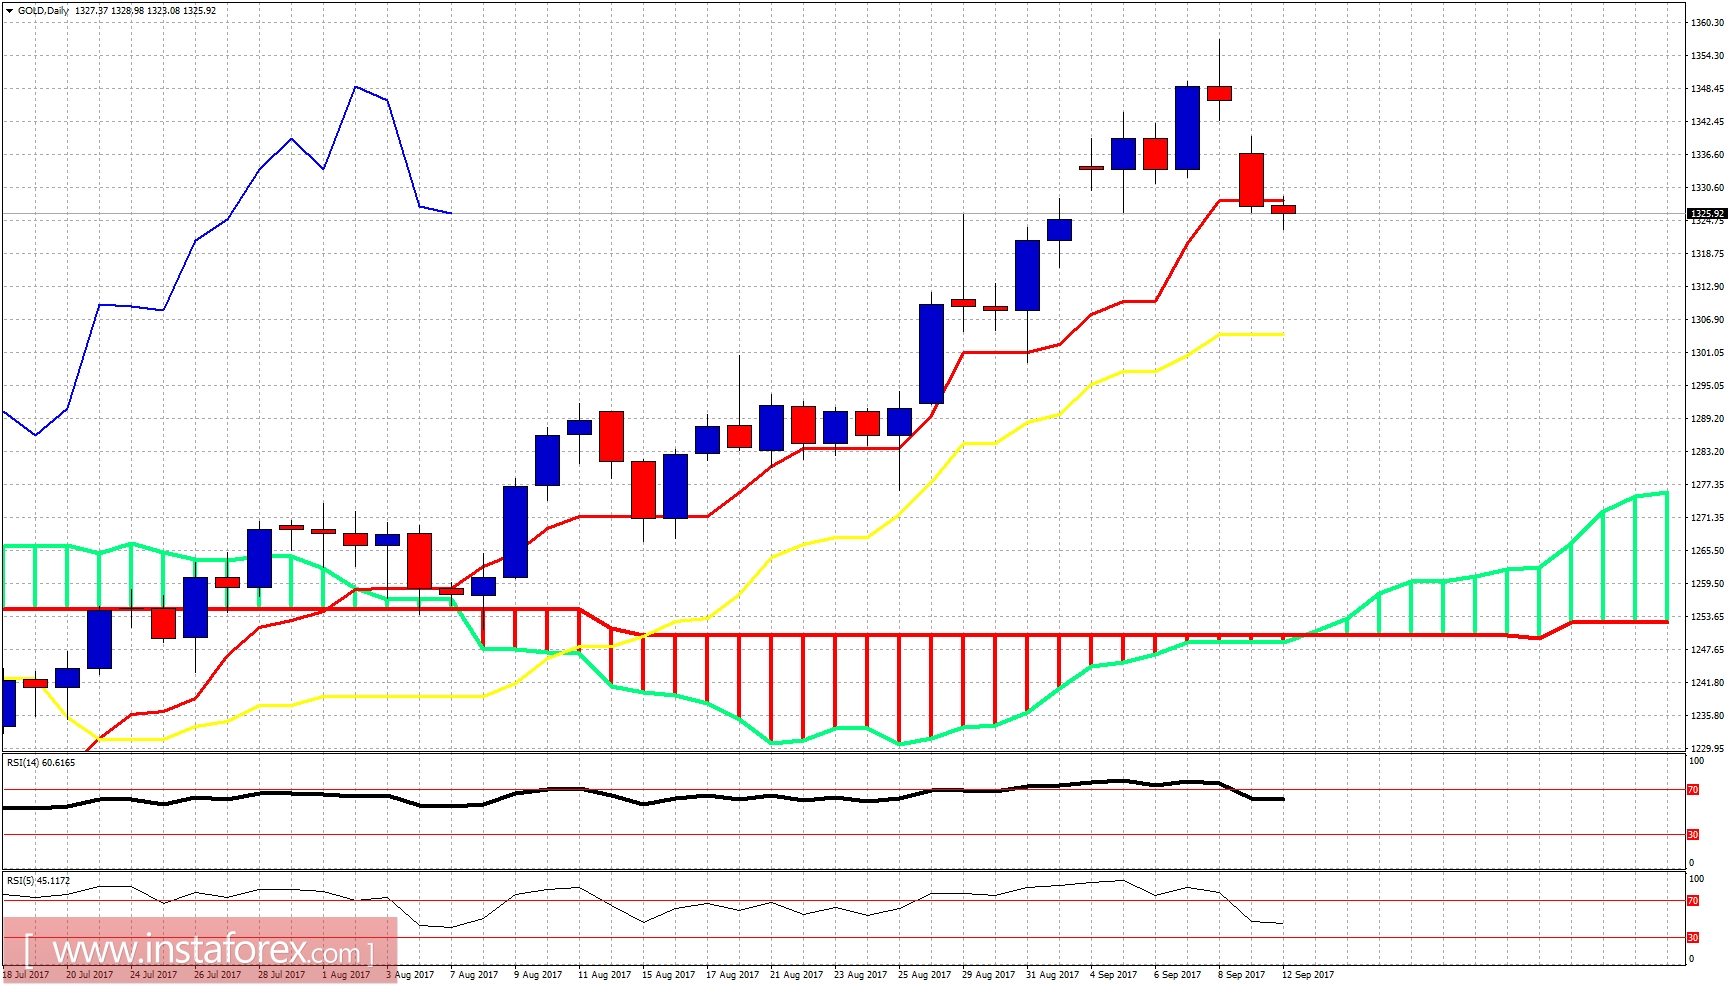
Gold price is trading below both the tenkan- and the kijun-sen indicators. But price has stopped the decline at the 4-hour Kumo while the RSI (5) is oversold and showing signs of reversal of short-term trend. This is not the time to sell Gold but to buy more. Why? Because our longer-term view remains bullish.

Ichimoku indicator analysis of gold for September 12, 2017

Gold price continues to make higher highs and higher lows on the daily chart. Price has just broken below the daily tenkan-sen. Support now can be found at the kijun-sen at $1,305. I see very slim chances of reaching the kijun-sen but as long as we trade below the tenkan-sen (red line indicator at $1,328.60) the short-term bearish scenario is still open. A daily close above the tenkan-sen will turn short-term trend to bullish again for a new high around $1,380.
Analyst InstaForex
Share this article:
parent
loader...
all-was_read__icon
You have watched all the best publications
presently.
We are already looking for something interesting for you...
all-was_read__star
Recently published:
loader...
More recent publications...