


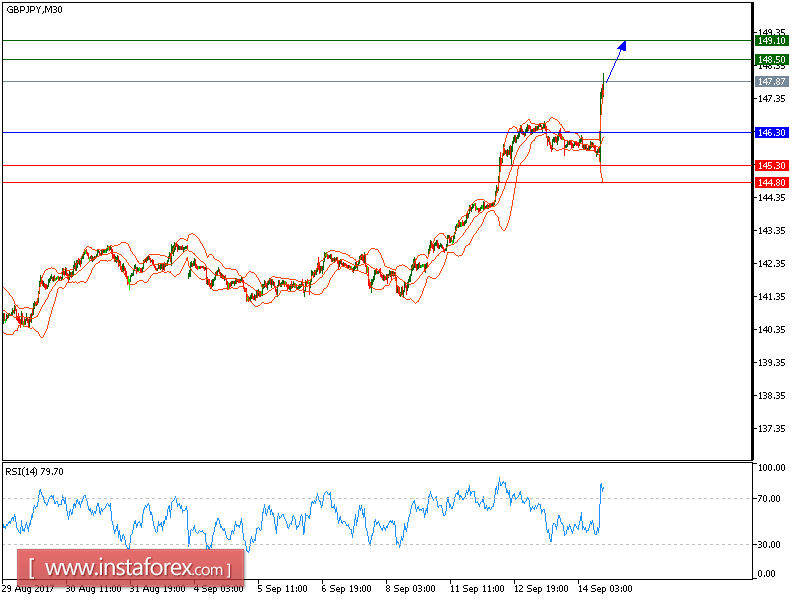
All our targets which we predicted in yesterday's analysis has been hit. GBP/JPY is expected to continue its upside movement. The pair broke above the declining trend line, which confirmed a negative outlook. The upward momentum is further reinforced by the risining 50-period moving average. The relative strength index is bullish and is calling for another upside.
Hence, as long as 146.30 is not surpassed, look for a new test to 148.50 and even to 149.10 in extension.
Alternatively, if the price moves in the direction opposite to the forecast, a short position is recommended below 146.30 with the target at 145.30.
Strategy: BUY, Stop Loss: 146.30, Take Profit: 148.50.
Chart Explanation: the black line shows the pivot point. The price above the pivot point indicates the bullish position; and when it is below the pivot points, it indicates a short position. The red lines show the support levels and the green line indicates the resistance levels. These levels can be used to enter and exit trades.
Resistance levels: 148.50, 149.10, and 149.60
Support levels: 145.30 144.80, and 144.00


