Main Quotes Calendar Forum
flag

FX.co ★ Ichimoku indicator analysis of gold for September 15, 2017

parent
Forex Analysis:::2017-09-15T04:54:20

Ichimoku indicator analysis of gold for September 15, 2017

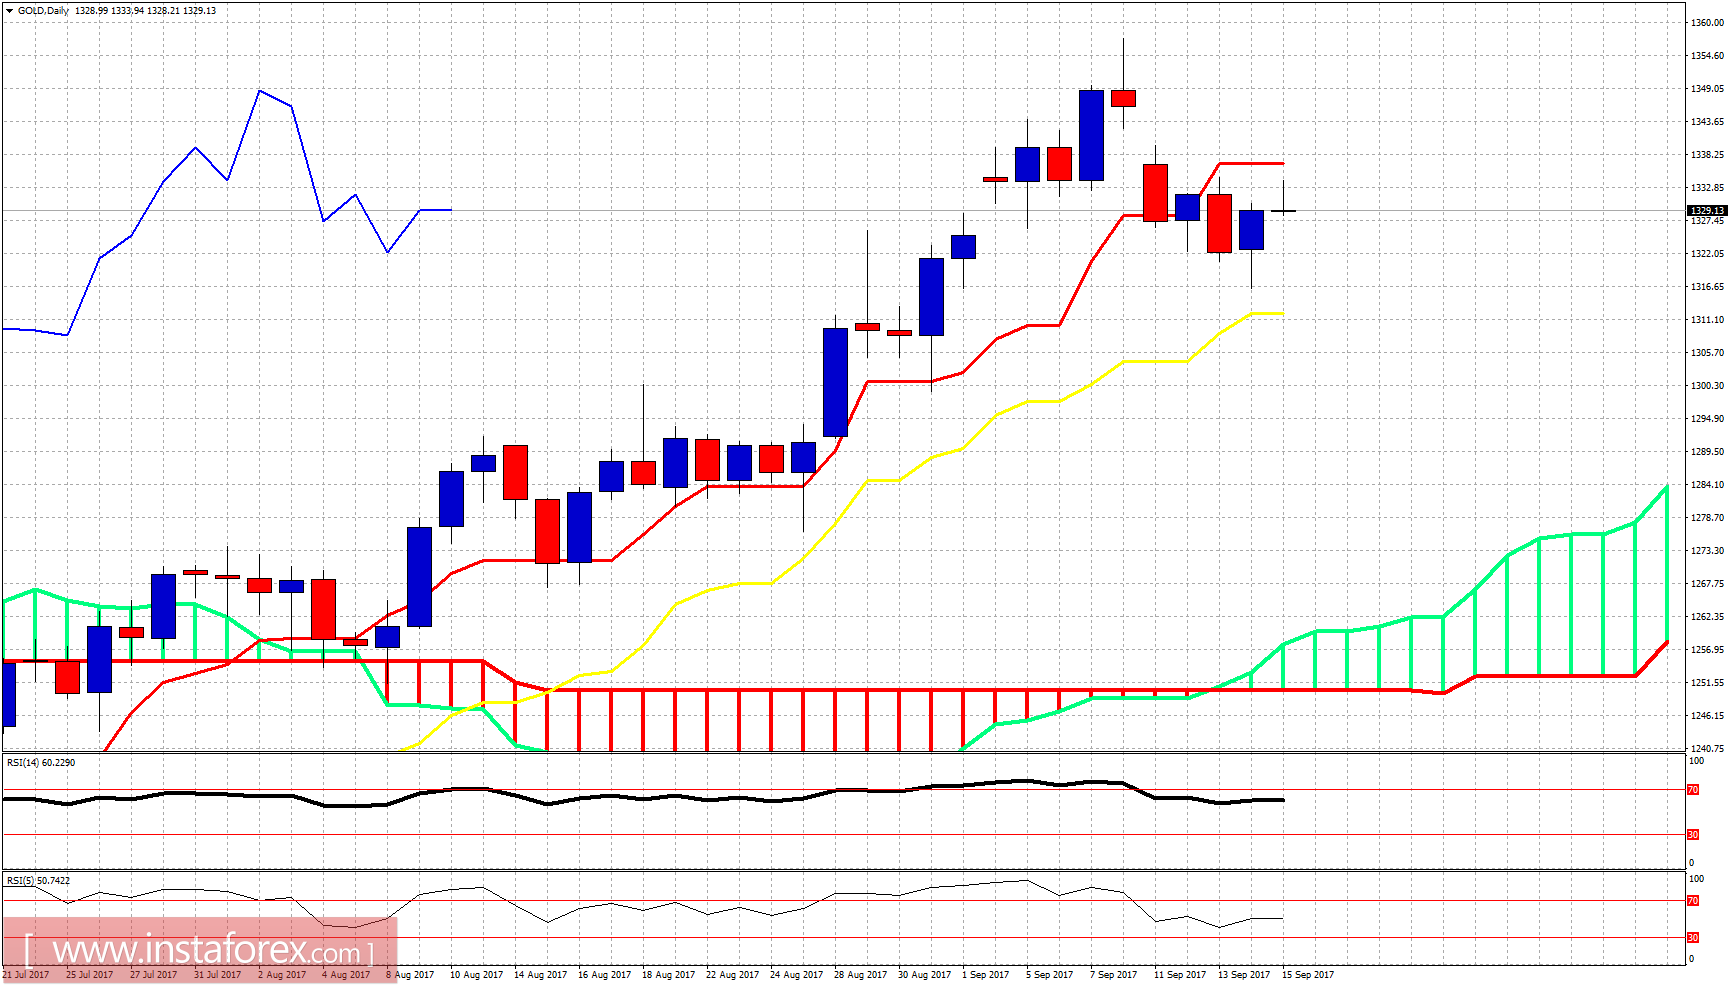
Gold price has bounced towards our important short-term resistance and trend change level of $1,334. Price got rejected. This is not a good sign for bulls. Short-term trend is weak and justified a deeper pull back towards $1,310.

Ichimoku indicator analysis of gold for September 15, 2017

Black rectangle - resistance

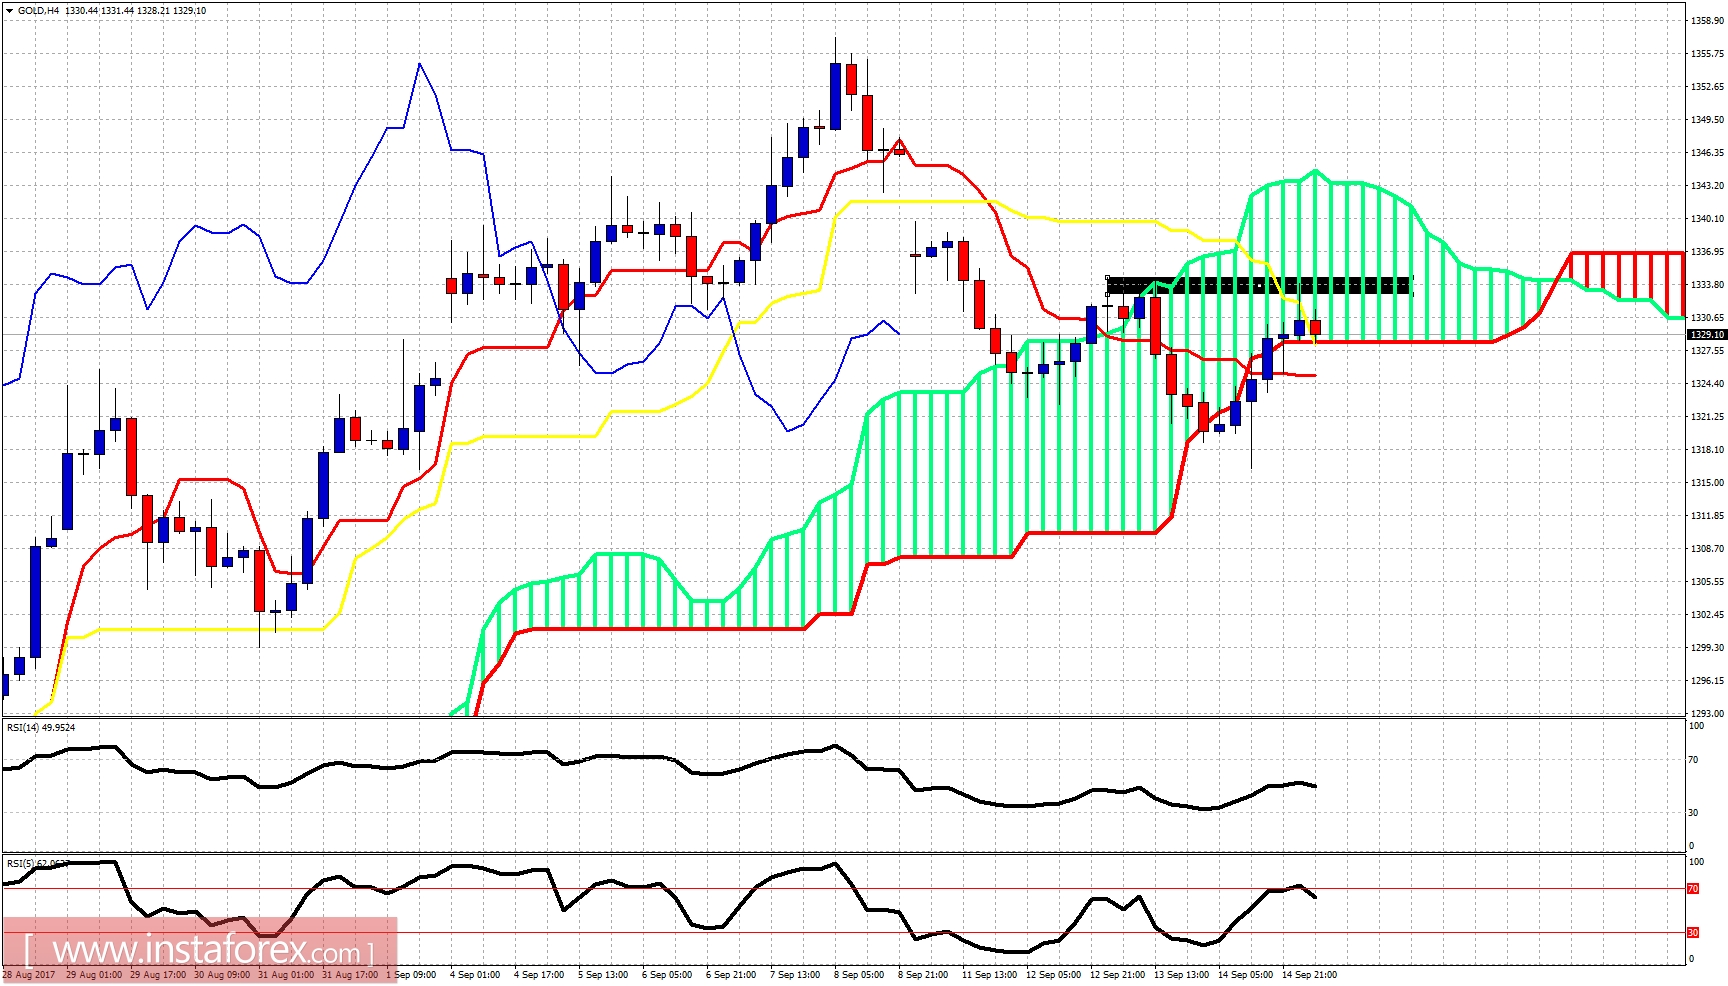
Gold price is back inside the cloud. However the rejection at the resistance implies more downside ahead. As long as price is below $1,334 price is in danger of making new lows towards $1,310-$1,300. In case resistance is broken, we should start our next move to new highs.

Ichimoku indicator analysis of gold for September 15, 2017

On a daily basis, we have a reversal candle so far. It is too early to tell, but the rejection at the tenkan-sen (Red line indicator) implies more downside to be expected. Longer-term we remain bullish looking for a move above $1,400.
Analyst InstaForex
Share this article:
parent
loader...
all-was_read__icon
You have watched all the best publications
presently.
We are already looking for something interesting for you...
all-was_read__star
Recently published:
loader...
More recent publications...