


USDX is still trading in a sideways range around the 200 SMA on H1 chart and is looking for a catalyst to determine the next path for the index. Broad-based weakness in the greenback remains as the main option, but if it makes a rebound above 91.67, we're expecting a rally to take place to reach the resistance zone of 93.09 in a first degree. MACD indicator is favoring the bulls, as it stays on the positive territory.
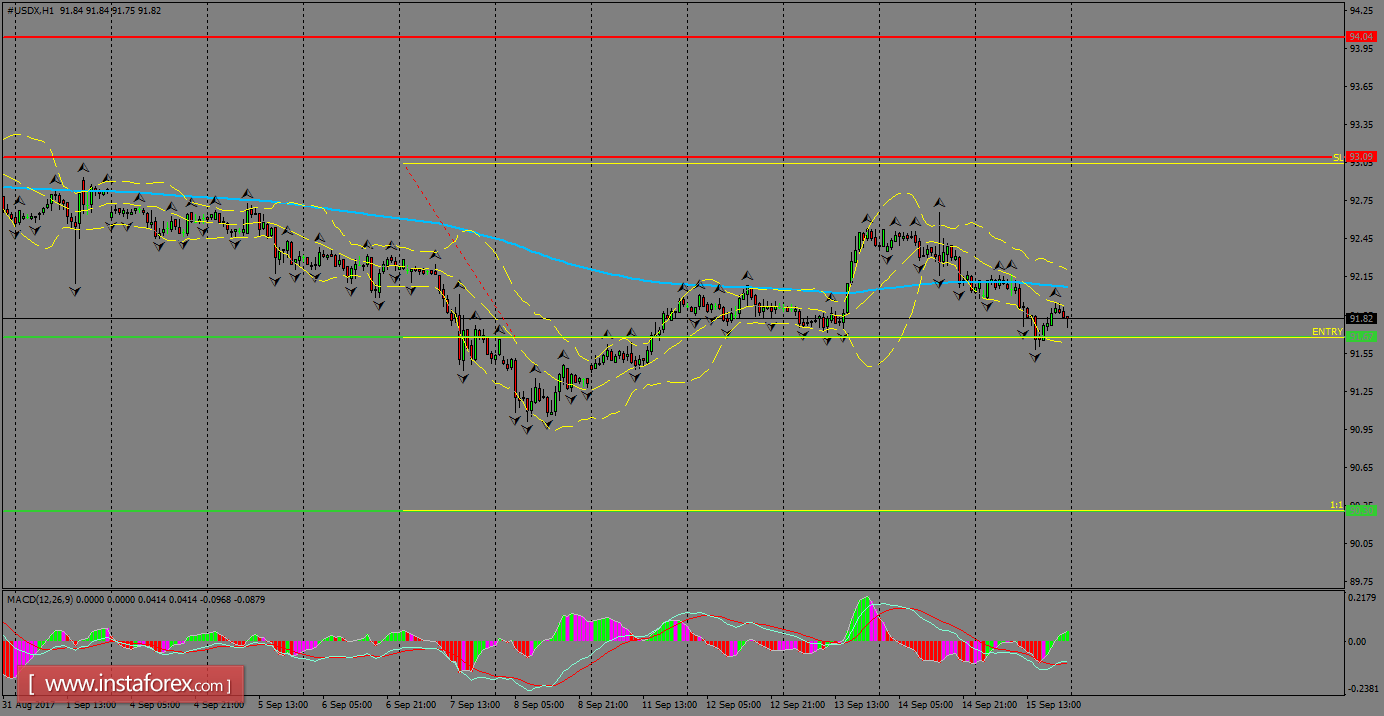
H1 chart's resistance levels: 93.09 / 94.04
H1 chart's support levels: 91.67 / 90.30
Trading recommendations for today: Based on the H1 chart, place sell (short) orders only if the USD Index breaks with a bearish candlestick; the support level is at 91.67, take profit is at 90.30 and stop loss is at 93.04.


