


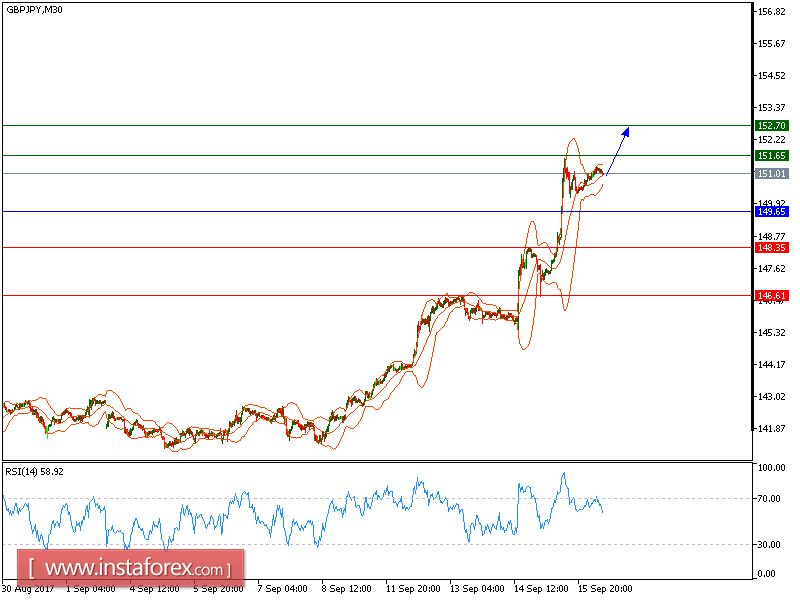
All our targets which we predicted in previous analysis have been hit. We will retain our upside prediction of GBP/JPY movement. The pair is expected to continue its upside movement and a further advance is expected. The pair is supported by its ascending 20-period and 50-period moving averages acting as support. On the technical side, the relative strength index is in the buying area between 50% and 70% but not overbought.
We suggest long positions above 149.65 with targets at 151.65 and 152.70 in extension.
Alternatively, if the price moves in the direction opposite to the forecast, a short position is recommended below 149.65 with the target at 148.35.
Strategy: BUY, Stop Loss: 149.65, Take Profit: 148.35.
Chart Explanation: the black line shows the pivot point. The price above the pivot point indicates the bullish position; and when it is below the pivot points, it indicates a short position. The red lines show the support levels and the green line indicates the resistance levels. These levels can be used to enter and exit trades.
Resistance levels: 151.65, 152.70, and 153.35
Support levels: 148.35, 146.60, and 146.00


