Main Quotes Calendar Forum
flag

FX.co ★ Ichimoku indicator analysis of USDX for September 20, 2017

parent
Forex Analysis:::2017-09-19T22:12:06

Ichimoku indicator analysis of USDX for September 20, 2017

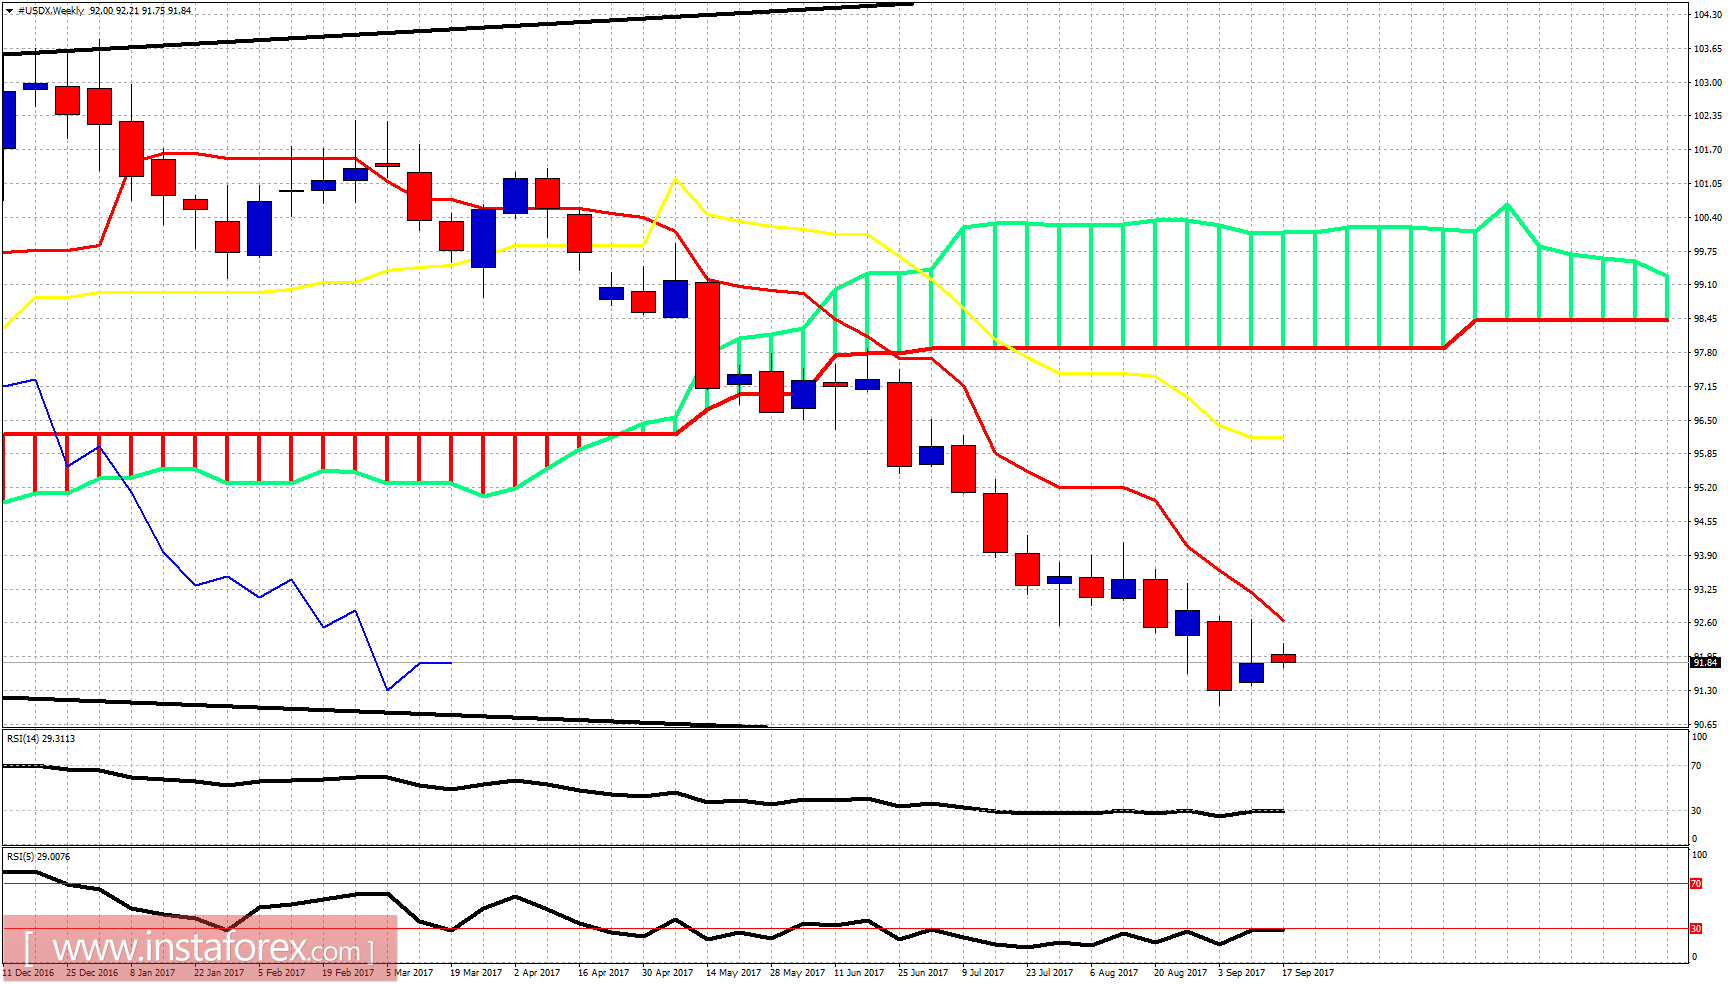
The Dollar index is weakening in the short term. We could soon see a move to new lows around or even below 90. Trend remains bearish.

Ichimoku indicator analysis of USDX for September 20, 2017

Black line -resistance

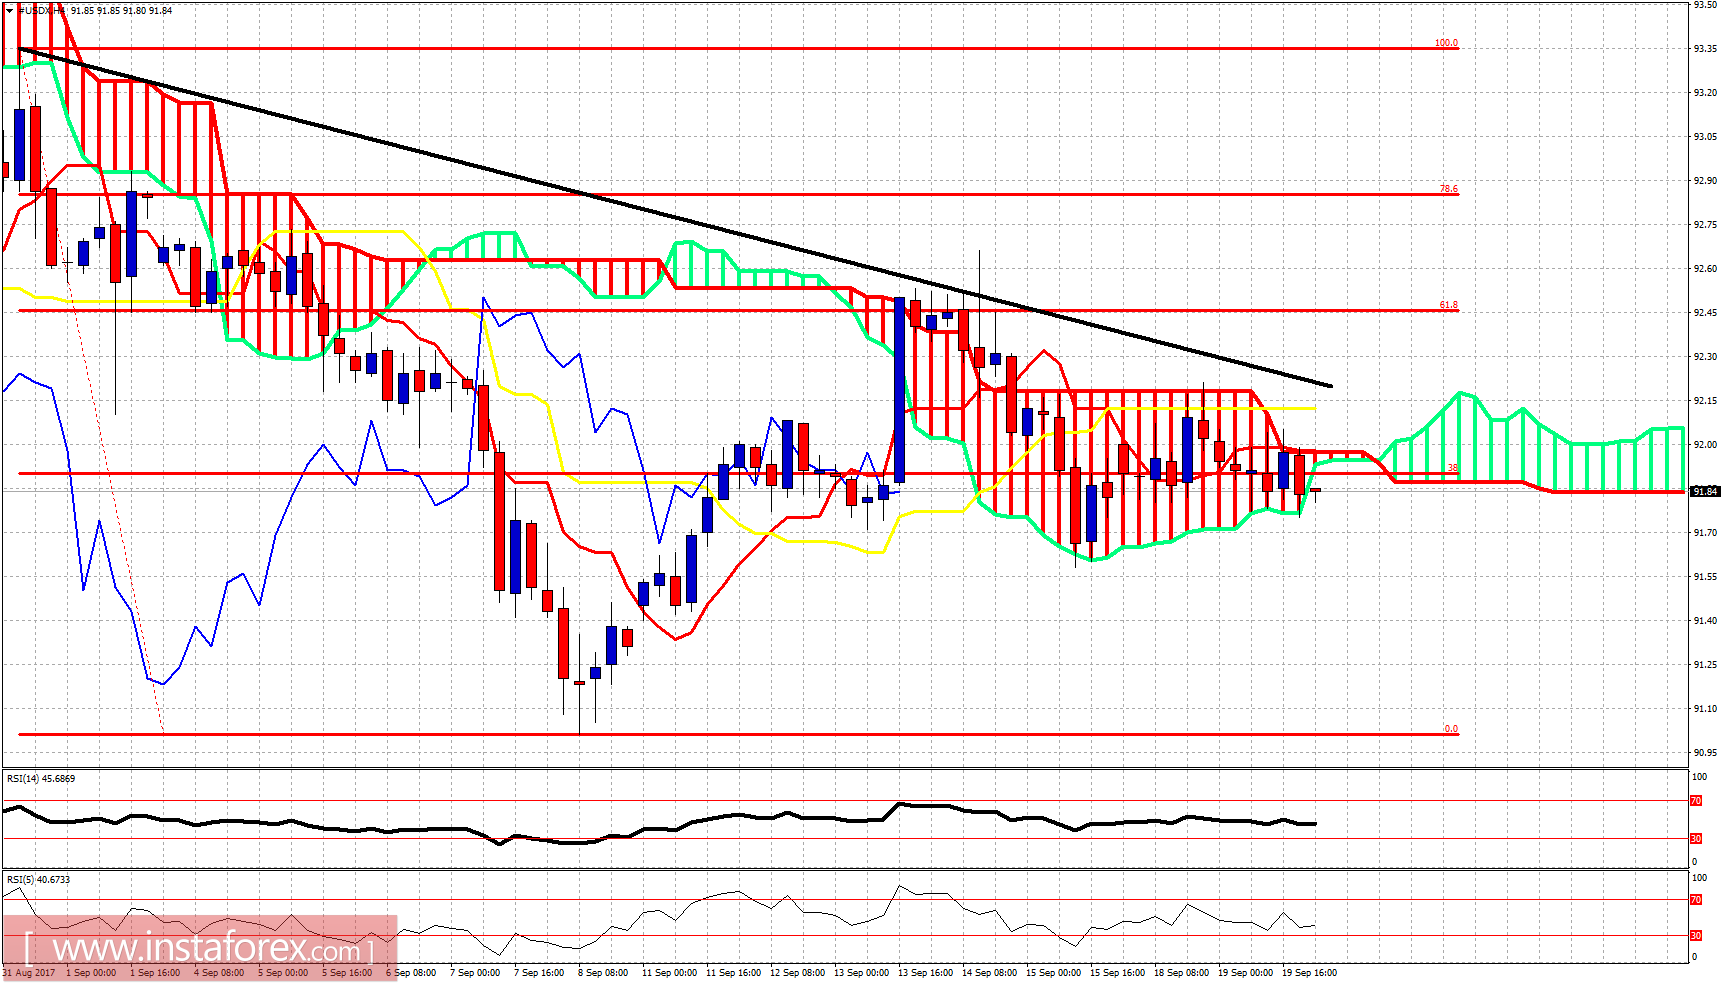
The Dollar index is trading below the black trend line resistance and is very close to breaking below and out of the Kumo (cloud). This would be a bearish sign, specially if it is combined with a move below 91.50.

Ichimoku indicator analysis of USDX for September 20, 2017

On a weekly basis, trend remains bearish. Price below both tenkan- and kijun-sen. A move towards 90 or lower is fully justified as long as price is below 92.70. Support is at 91.50 and if we see this level broken, we should expect price to accelerate lower towards 90.
Analyst InstaForex
Share this article:
parent
loader...
all-was_read__icon
You have watched all the best publications
presently.
We are already looking for something interesting for you...
all-was_read__star
Recently published:
loader...
More recent publications...