


The index remains in the wait-and-see mode ahead of key macroeconomic releases in the United States. The support level of 91.67 is still a strong barrier for sellers and a key demand zone where bulls could gather momentum in order to reach the resistance zone of 93.09. To the downside, if the US Dollar Index manages to break below that area, further declines are expected toward 90.30.
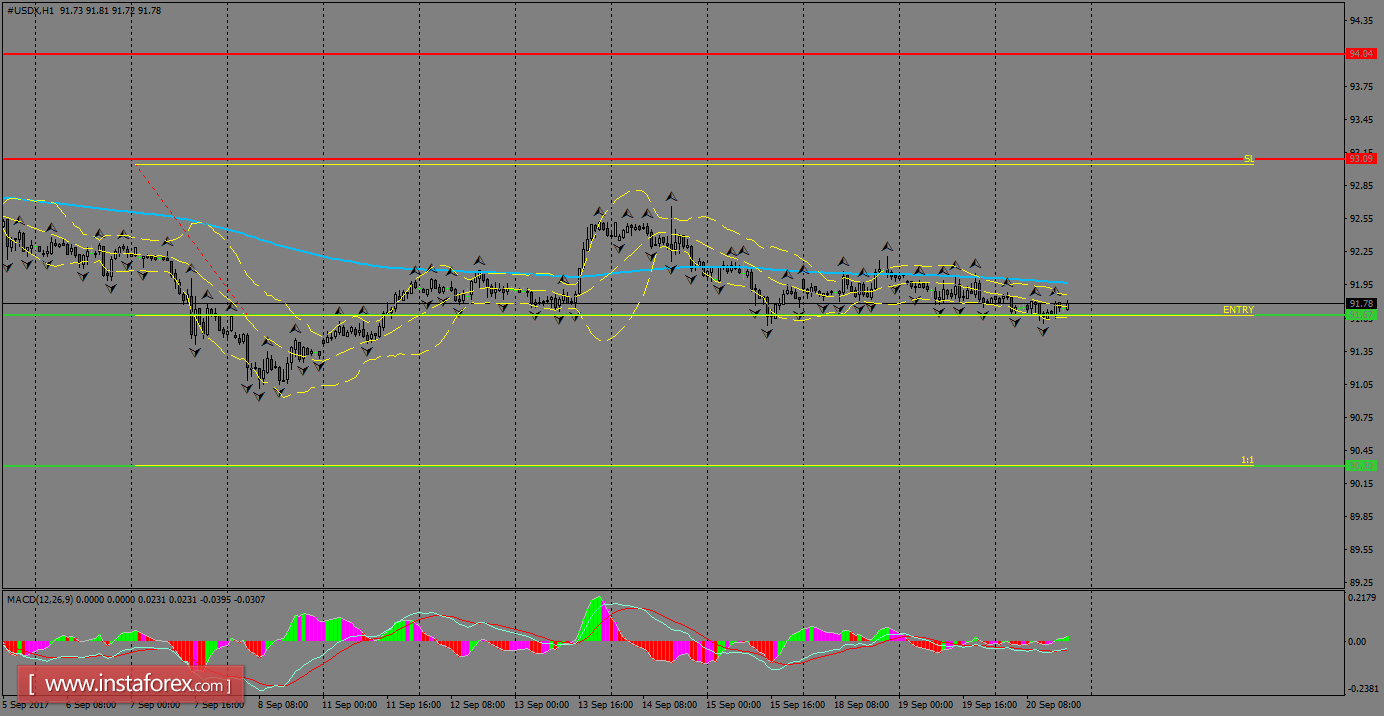
H1 chart's resistance levels: 93.09 / 94.04
H1 chart's support levels: 91.67 / 90.30
Trading recommendations for today: Based on the H1 chart, place sell (short) orders only if the USD Index breaks with a bearish candlestick; the support level is at 91.67, take profit is at 90.30 and stop loss is at 93.04.


