


Gold price as expected made a new lower low yesterday after the FOMC policy announcements. Price has broken below $1,300. Gold price is still inside the bearish channel heading towards next support of $1,288-80. Longer-term view remains bullish and we consider this pullback as an excellent opportunity to buy gold for above $1,400.
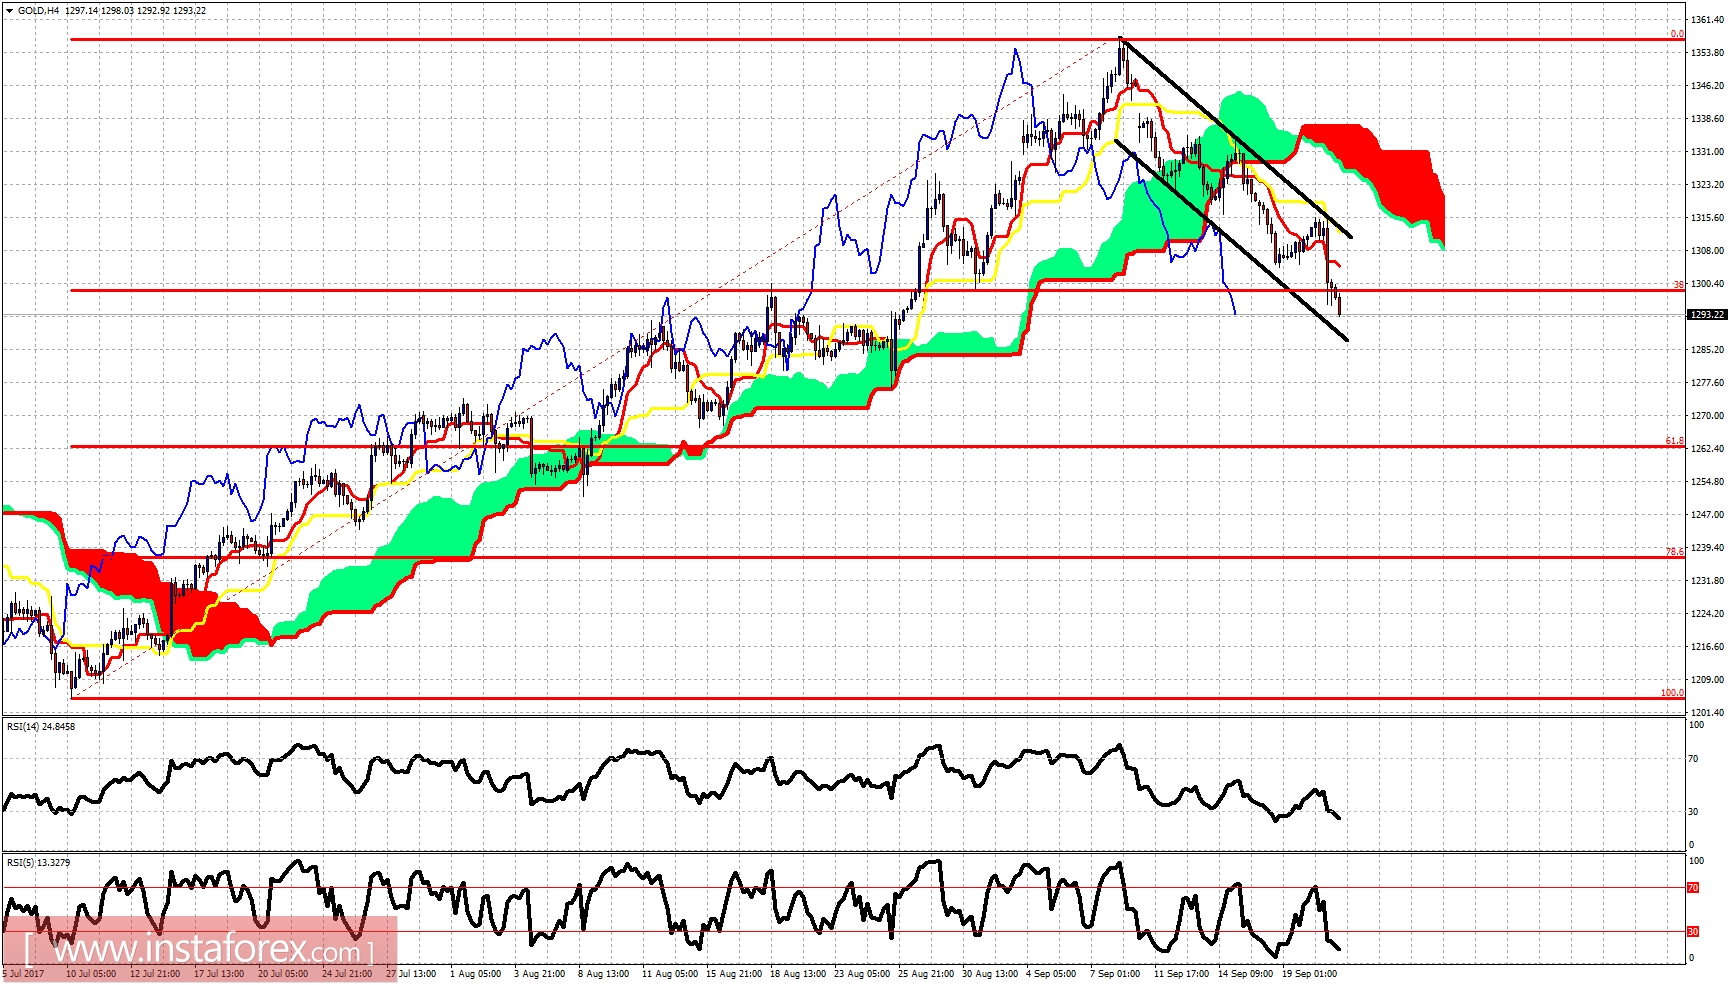
Gold price is trading just below the 38% Fibonacci retracement support. The oscillators are showing minor divergence signs. We were cautious about Gold above $1,350 that is calling for a pullback. Now I believe we are very close to an important turning point. Gold is expected to reverse to the upside. Price action so far is corrective. Cloud resistance is at $1,323. Technical resistance is at $1,316. Support is at $1,290-88 area.
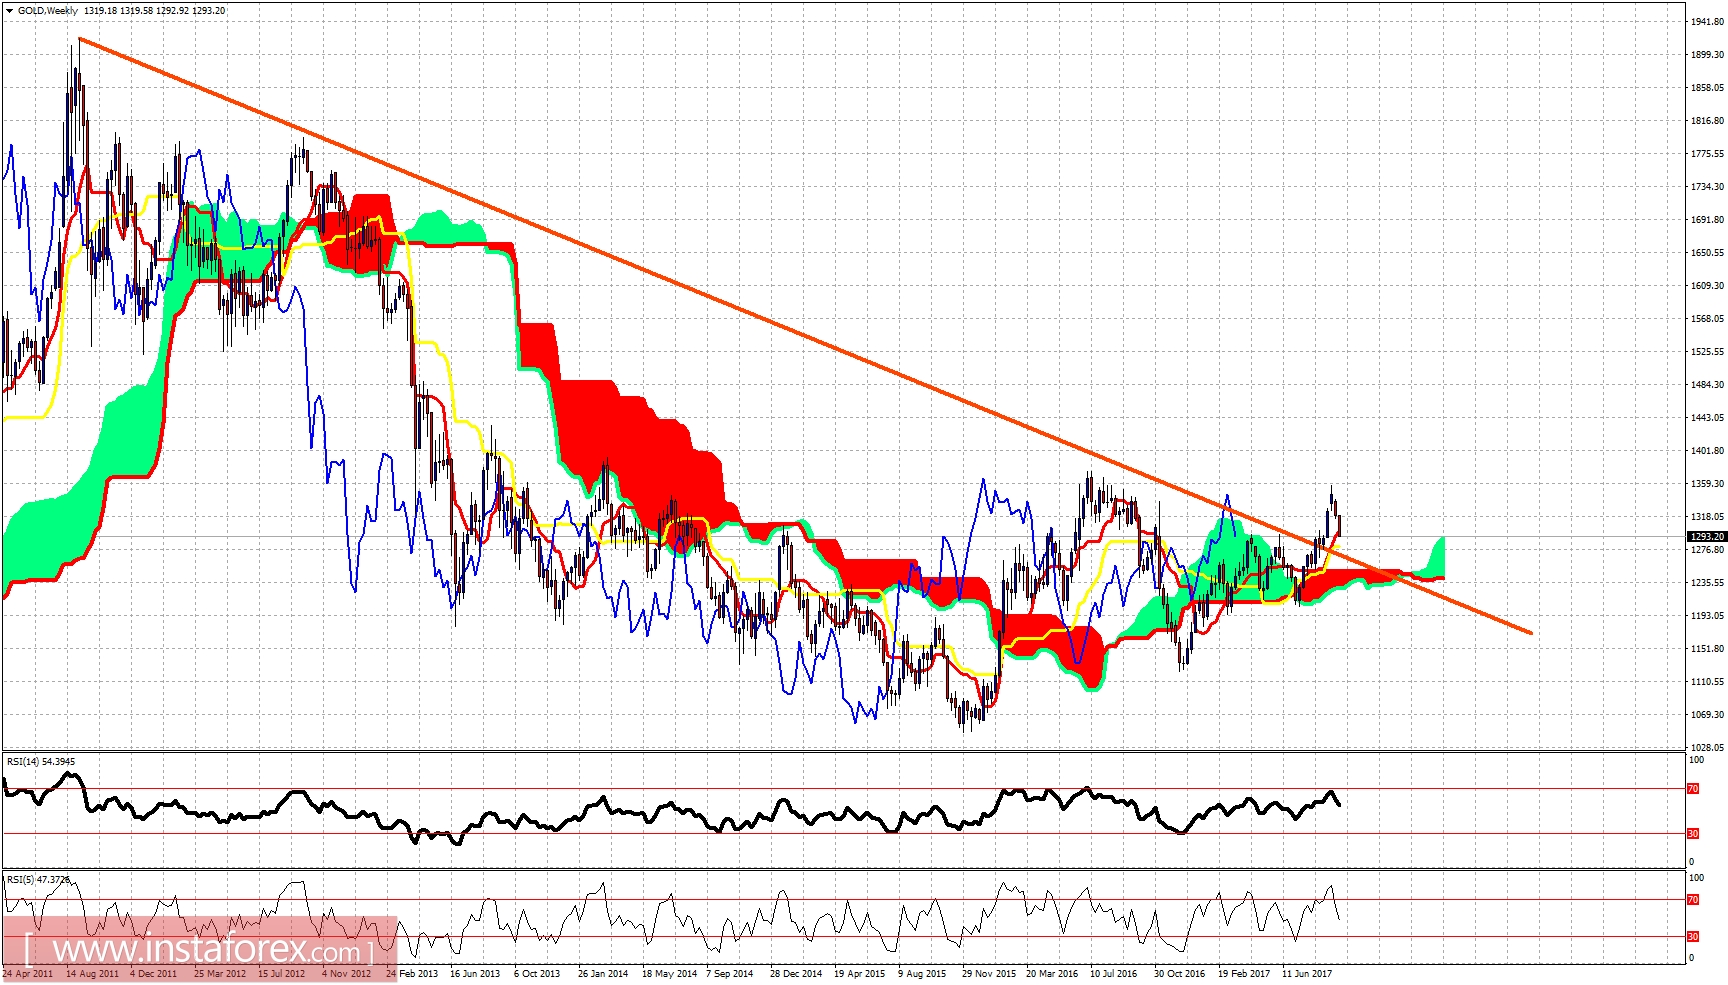
Gold price has not only broken above the long-term trend line resistance but also above the weekly Kumo (cloud). This pullback is a back test. Weekly support is at $1,280 by the kijun-sen (yellow line indicator) and at $1,300 by the tenkan-sen. I believe this pullback is a buying opportunity. A bear trap for weak longs that entered the bullish is above $1,300.


