Main Quotes Calendar Forum
flag

FX.co ★ Ichimoku indicator analysis of USDX for September 22, 2017

parent
Forex Analysis:::2017-09-22T07:08:39

Ichimoku indicator analysis of USDX for September 22, 2017

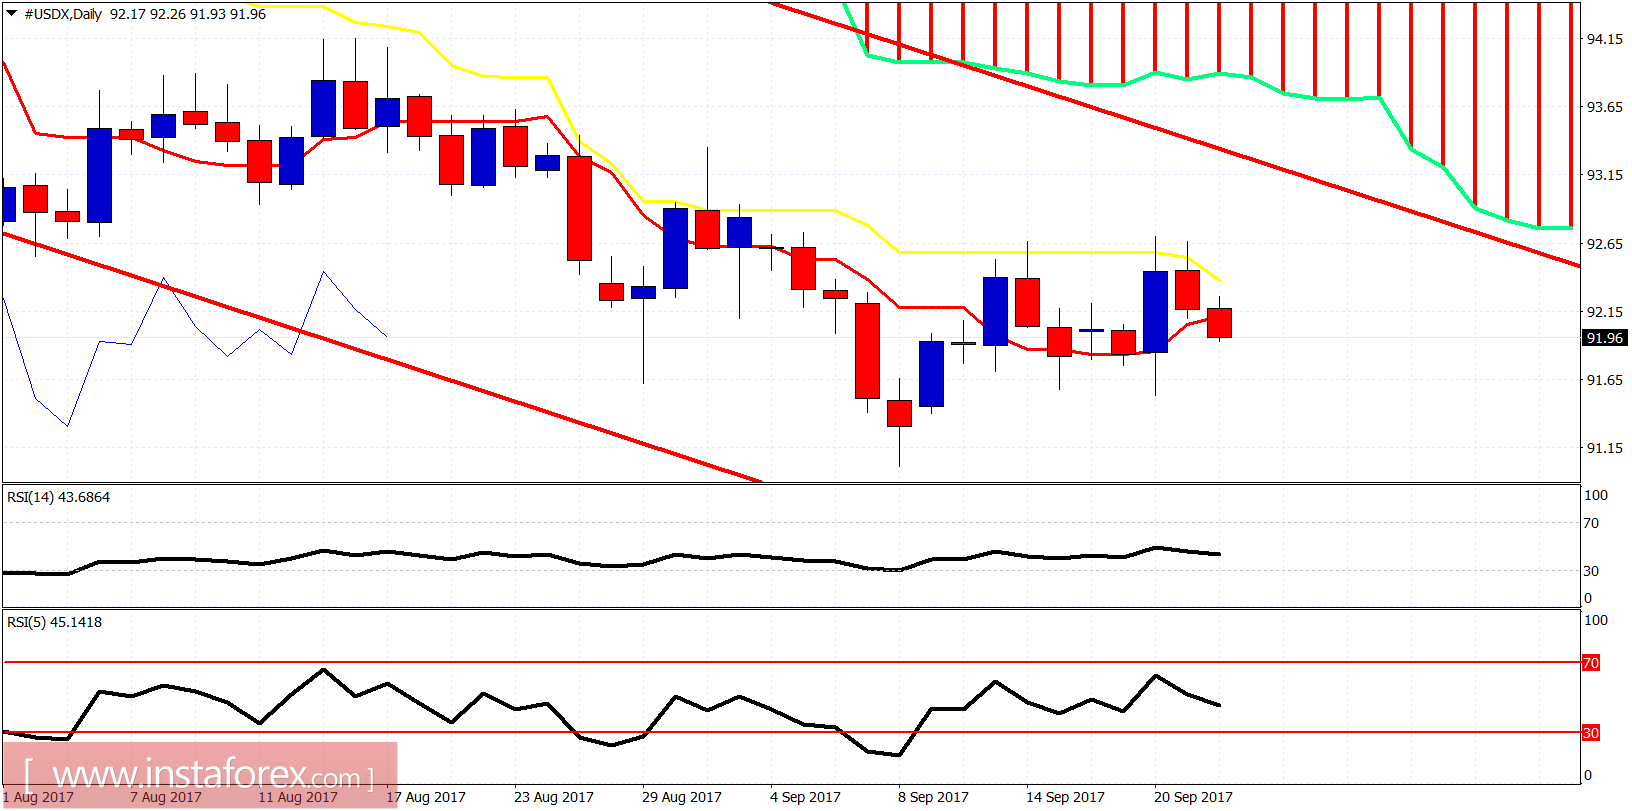
The Dollar index despite making a new short-term high near 92.50, is pulling back as expected by our previous post towards the 92 cloud support. Is this a fake breakout like the last time or a back test that will provide a new bounce?

Ichimoku indicator analysis of USDX for September 22, 2017

Red line - resistance

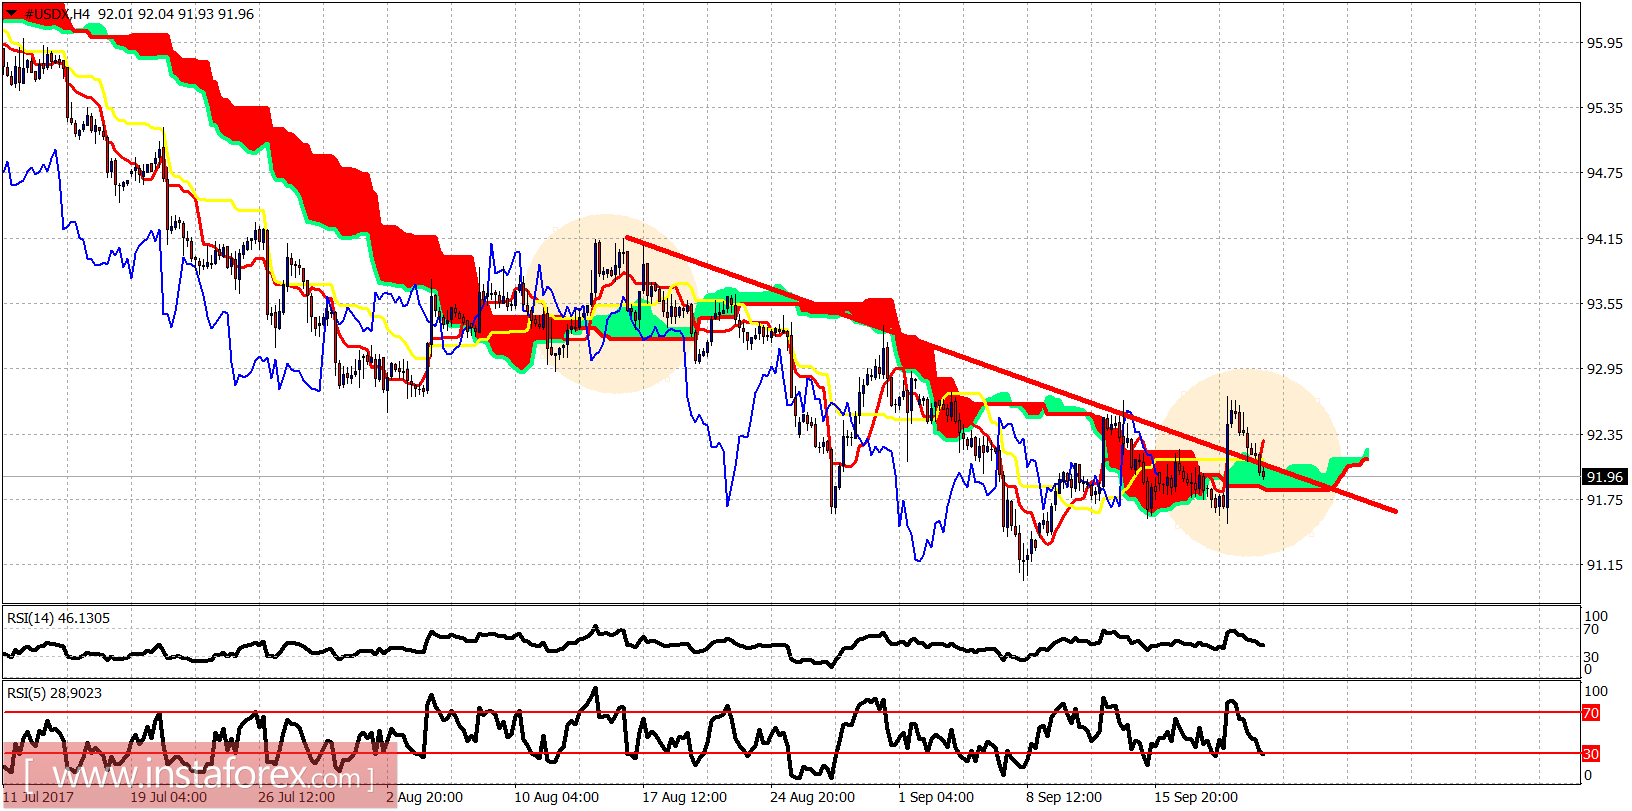
The Dollar index has broken above the red trend line and is now back testing it. Price has also broken above the 4-hour Kumo (cloud) and is back testing it again. The last time price broke above the 4-hour Kumo we witnessed a false break out and a reversal. Will the bearish trend resume? There are high chances of this happening specially if price breaks below support at 91.60.

Ichimoku indicator analysis of USDX for September 22, 2017

On a daily basis, price remains in a bearish long-term channel. Price got rejected yesterday at the kijun-sen (yellow line indicator) and is now trading below the tenkan-sen also. This is a bearish sign. The entire upward correction could be over already. Key support is at 91.50. Break it and we go below 90.
Analyst InstaForex
Share this article:
parent
loader...
all-was_read__icon
You have watched all the best publications
presently.
We are already looking for something interesting for you...
all-was_read__star
Recently published:
loader...
More recent publications...