


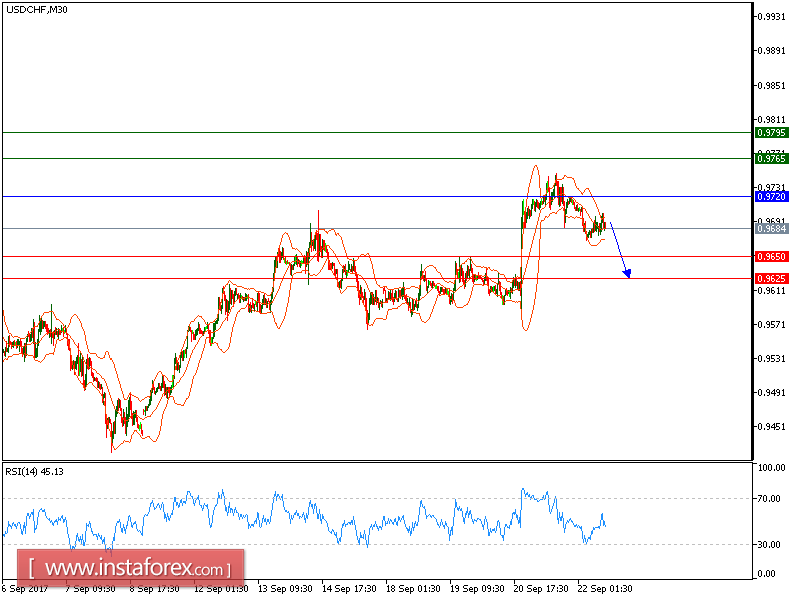
USD/CHF is expected to trade with a bearish outlook. The pair retreated from 0.9720 and broke below its 20-period and 50-period moving averages. In addition, the 20-period moving average crossed below the 50-period one. The relative strength index is showing downside momentum.
The U.S. dollar got a boost from the Federal Reserve's agenda for another interest rate increase until the year end.
To conclude, as long as 0.9720 is not surpassed, look for a further drop to 0.9650. A break below this level would trigger a new decline to 0.9625.
Chart Explanation: The black line shows the pivot point. The present price above the pivot point indicates a bullish position, and the price below the pivot points indicates a short position. The red lines show the support levels and the green line indicates the resistance levels. These levels can be used to enter and exit trades.
Strategy: BUY, Stop Loss: 0.9720, Take Profit: 0.9650
Resistance levels: 0.9765, 0.9795, and 0.98830
Support levels: 0.9650, 0.9625, and 0.9775


