


Gold price remains inside the bearish channel still. Price is trading above recent lows. There are increased chances of a new lower low towards $1,285-80 but I believe the downside is very limited, while the upside potential is very big.
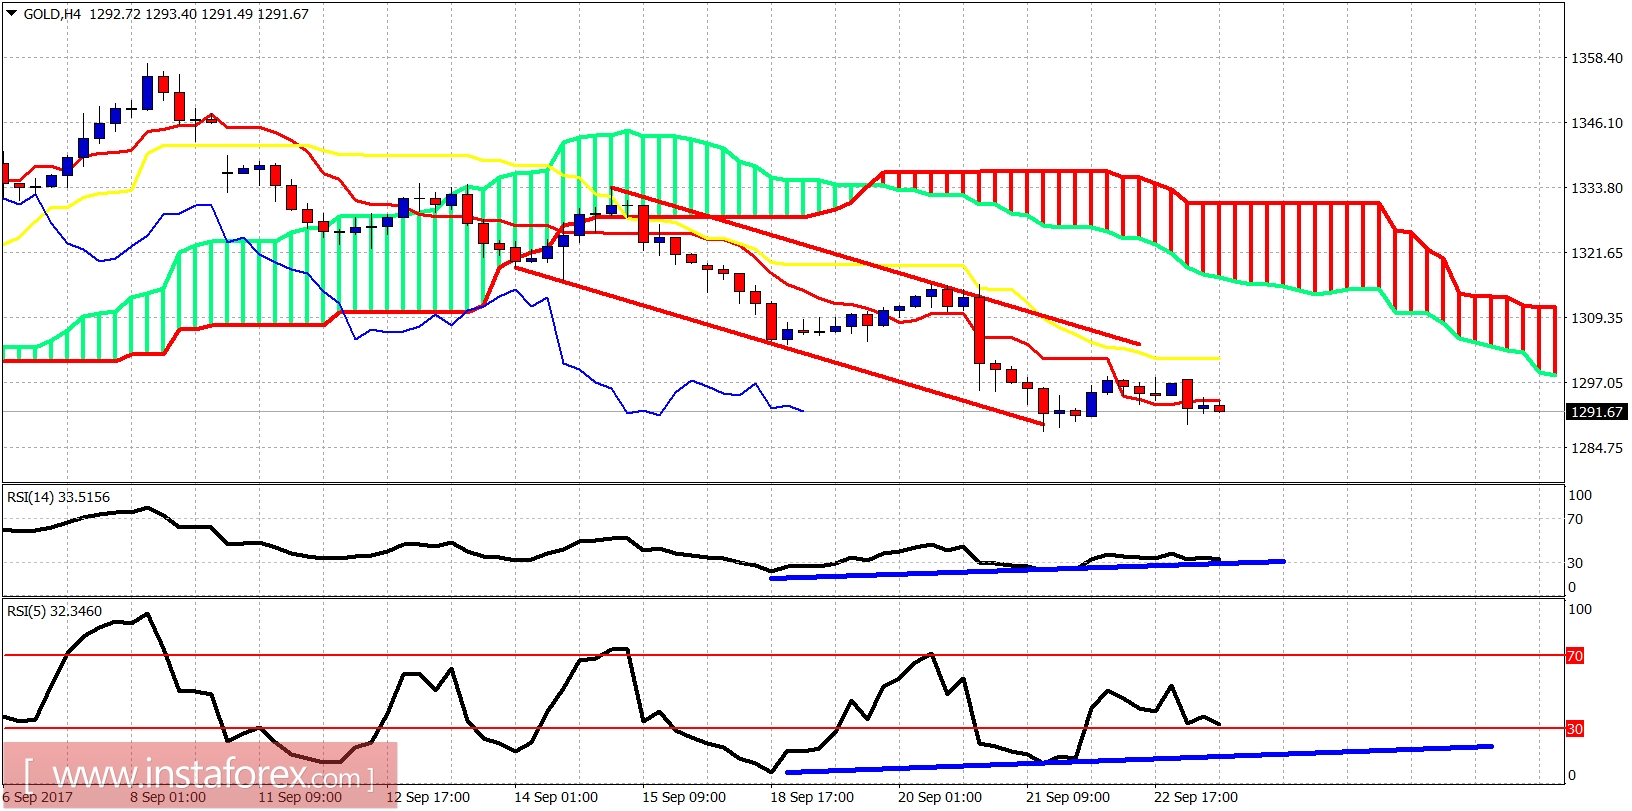
Blue lines - bullish divergence signs
Gold price is below the tenkan- and kijun-sen in the 4-hour chart and inside the bearish channel. Support is at $1,290 and next one at $1,280. Resistance is at $1,300 and next one at $1,316. I believe that Gold price could make another stop run to shake out weak bulls and then reverse.
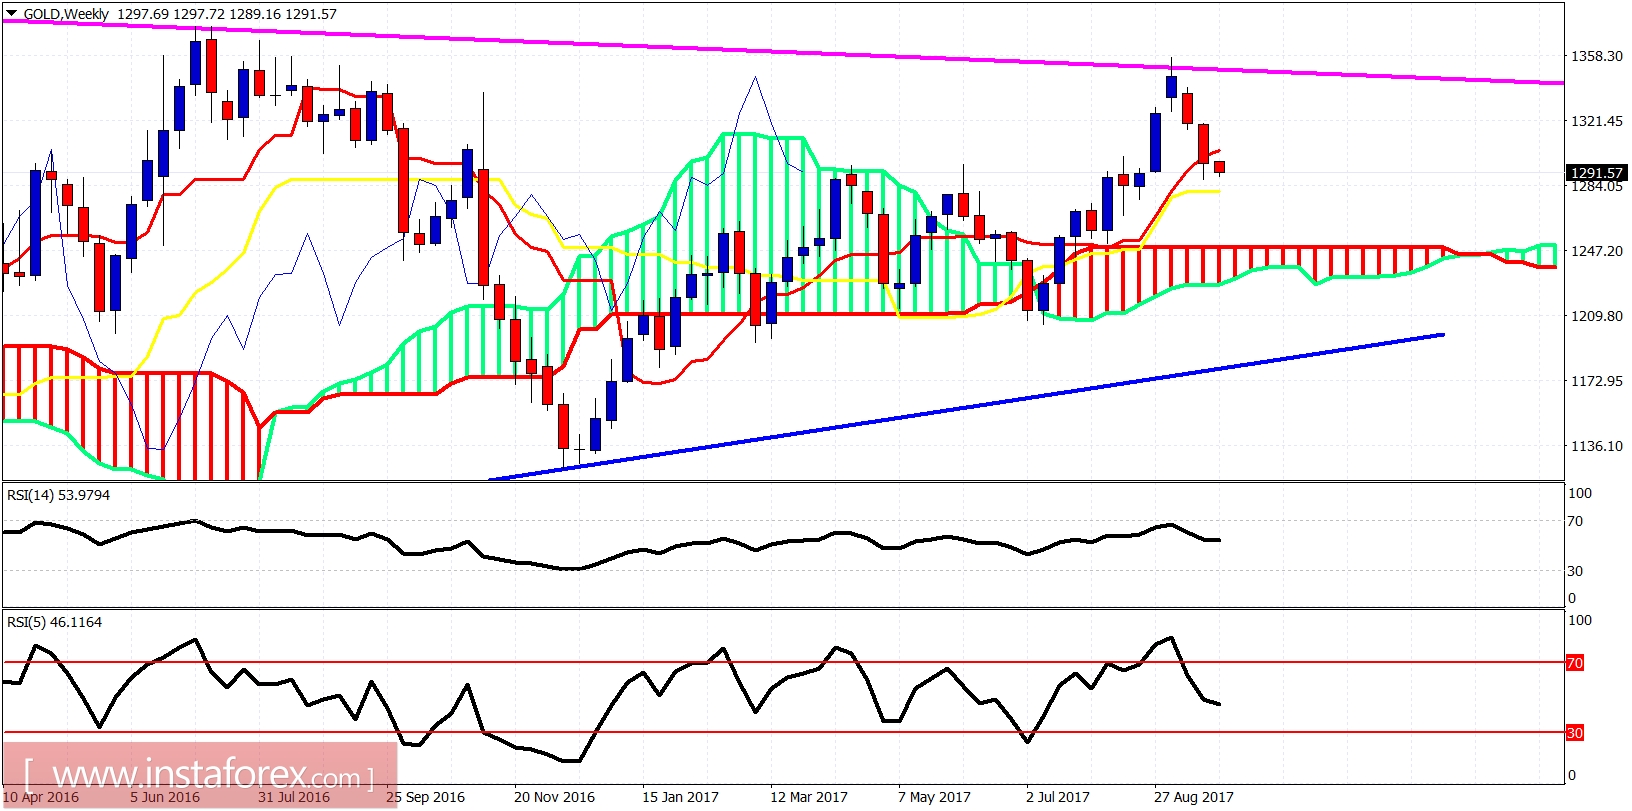
Magenta line - resistance
Blue line - long-term support trend line
Gold price is pulling back from the resistance trend line. This pullback is considered one great buying opportunity. I believe that Gold will bottom around $1,290-$1,280 and then reverse to start the next big upward move towards $1,400. I remain longer-term bullish about Gold.


