


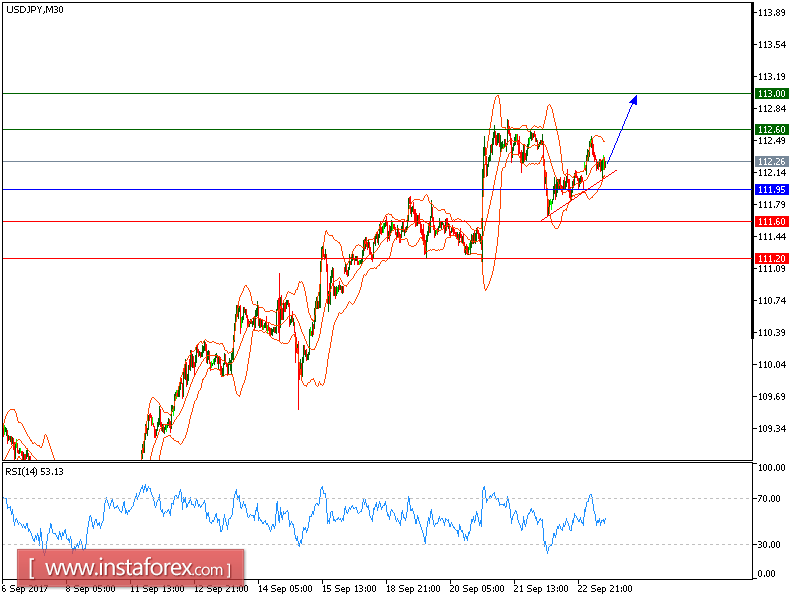
USD/JPY is expected to trade with a bullish bias above 111.95. The technical outlook of the pair is bullish as the prices are supported by a bullish trend line since September 22. The 20-period moving average is turning up and is about to cross above the 50-period one. The relative strength index is calling for a new upleg.
Hence, as long as 111.95 is not broken, look for a further upside to 112.60 and even to 113.00 in extension.
Alternatively, if the price moves in the opposite direction, a short position is recommended below 111.95 with a target at 111.60.
Chart Explanation: The black line shows the pivot point. The current price above the pivot point indicates a bullish position, while the price below the pivot point is a signal for a short position. The red lines show the support levels and the green line indicates the resistance level. These levels can be used to enter and exit trades.
Strategy: BUY, Stop Loss: 111.95, Take Profit: 112.60
Resistance levels: 112.60, 113.00 and 113.45 Support Levels: 111.60, 111.20, 110.80


