


All our targets which we predicted in yesterday's analysis have been hit. NZD/JPY is still under pressure and still expected to trade in a lower range. Although the pair posted a rebound from 0.7245, the upside potential should be limited by the key resistance at 0.7245. Even though a continuation of the technical rebound cannot be ruled out, its extent should be limited.
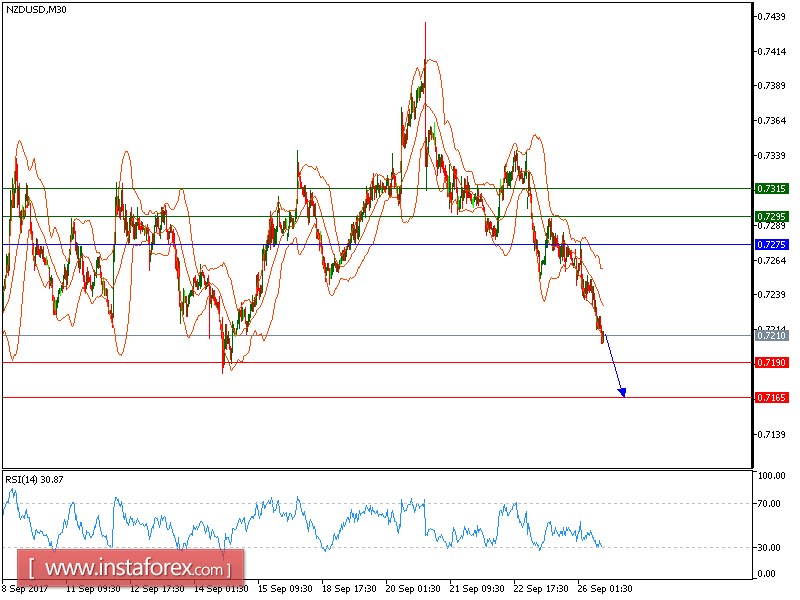
To conclude, as long as 0.7245 holds on the upside, look for a new decline with targets at 0.7190 and 0.7165 in extension.
The black line is showing the pivot point. Currently, the price is above the pivot point, which indicates long positions. If it remains below the pivot point, it will indicate short positions. The red lines is showing the support levels and the green line is indicating the resistance levels. These levels can be used to enter and exit trades.
Resistance levels: 0.7295, 0.7315, and 0.7350
Support levels: 0.7190, 0.7165, and 0.7125


