


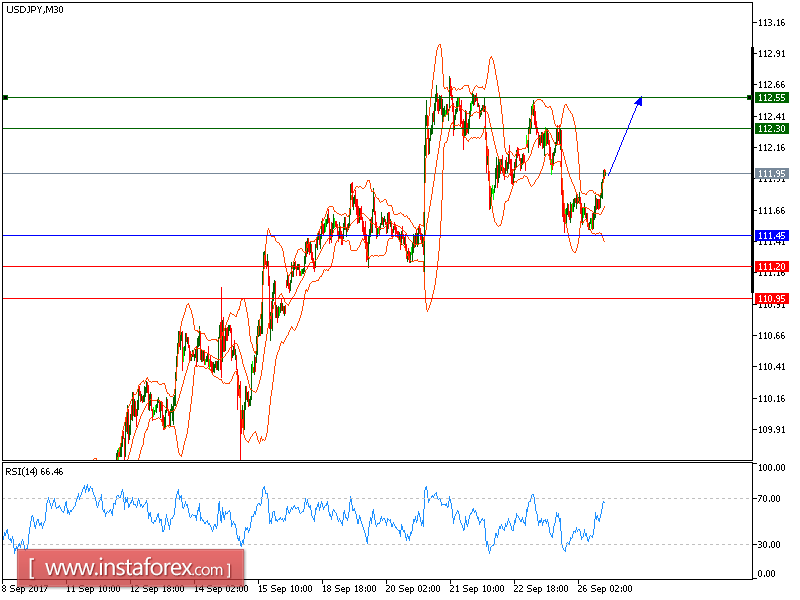
USD/JPY is expected to trade with a bullish outlook. The pair posted a rebound from 111.45 (the low of September 25), it is still trading above the uprising 20-period moving average, which plays a support role. The relative strength index is above its neutrality level at 50.
Therefore, as long as 111.45 is not surpassed, look for a further upside movement with targets at 112.30 and 112.55 in extension.
Alternatively, if the price moves in the opposite direction, a short position is recommended below 111.45 with a target at 111.20.
Chart Explanation: The black line shows the pivot point. The current price above the pivot point indicates a bullish position, while the price below the pivot point is a signal for a short position. The red lines show the support levels and the green line indicates the resistance level. These levels can be used to enter and exit trades.
Strategy: BUY, Stop Loss: 111.45, Take Profit: 112.30
Resistance levels: 112.30, 112.55 and 112.75 Support Levels: 111.20, 110.95, 110.80


