


The index gained momentum across the board and it's piercing the resistance level of 93.09. The 200 SMA provided dynamic support and helped to push higher to USDX. Now, it's looking to test the resistance zone of 94.04, at which bulls could gather momentum. To the downside, a critical support lies at 91.67.
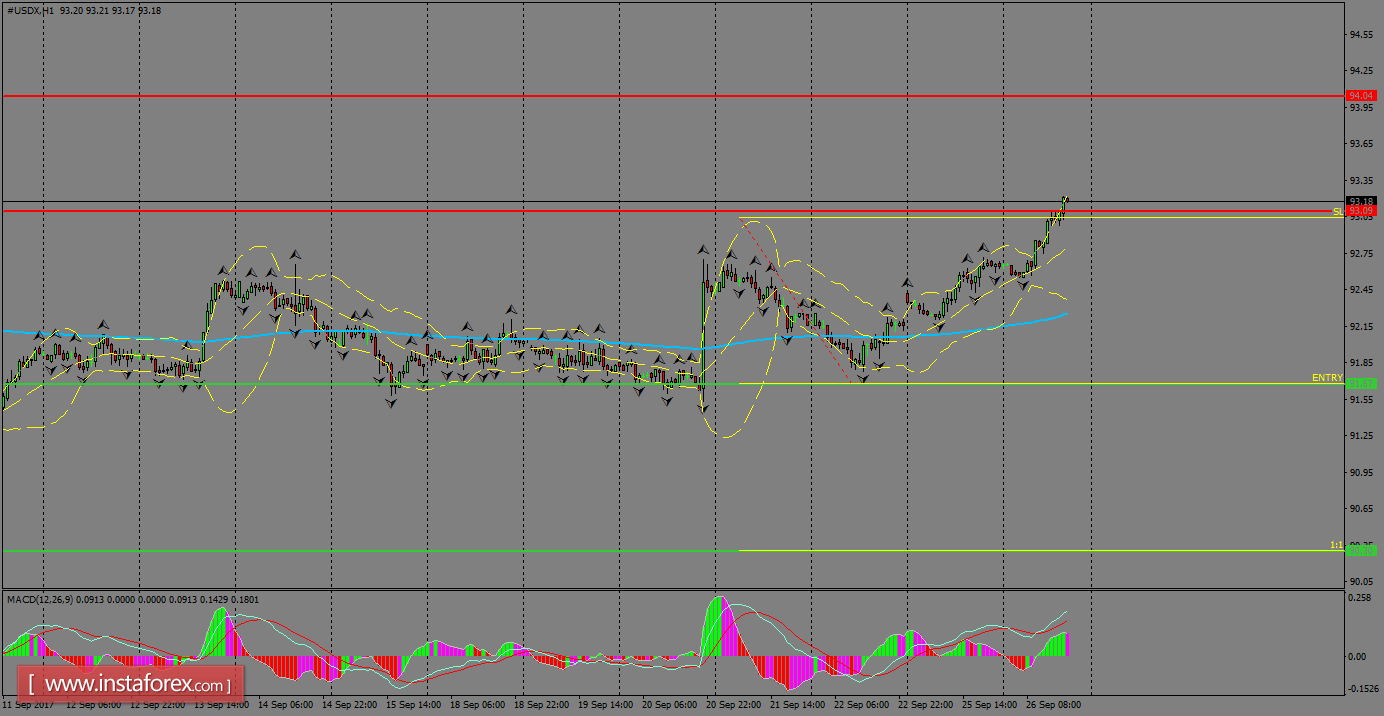
H1 chart's resistance levels: 93.09 / 94.04
H1 chart's support levels: 91.67 / 90.30
Trading recommendations for today: Based on the H1 chart, place sell (short) orders only if the USD Index breaks with a bearish candlestick; the support level is at 91.67, take profit is at 90.30 and stop loss is at 93.04.


