


Daily Outlook
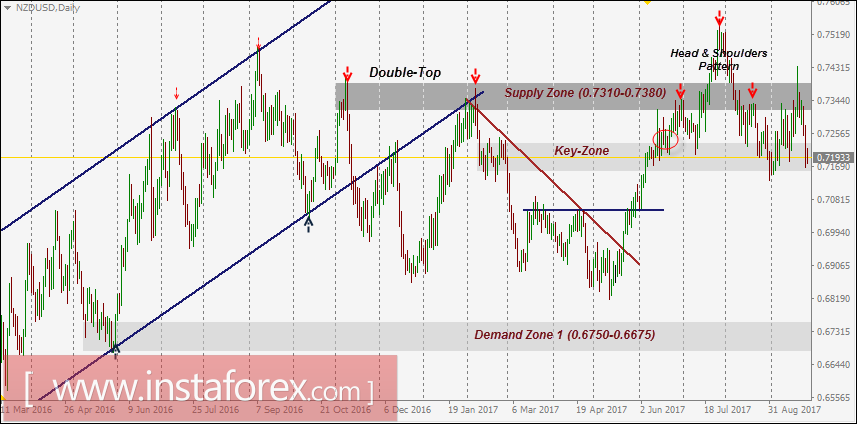
In February 2017, the depicted short-term downtrend was initiated around the depicted supply zone (0.7310-0.7380).
However, a recent bullish breakout above the downtrend line took place on May 22. Since then, the market has been bullish as depicted on the chart.
The price zone of 0.7150-0.7230 (Key-Zone) stood as a temporary resistance zone until a bullish breakout was expressed above 0.7230.
This resulted in a quick bullish advance towards the next supply zone around 0.7310-0.7380 which was temporarily breached to the upside.
The recent bearish pullback was executed towards the price zone of 0.7310-0.7380 (newly-established demand-zone) which failed to offer enough bullish support for the NZD/USD pair.
Re-consolidation below the price level of 0.7300 enhances the bearish side of the market. This brings the NZD/USD pair again towards 0.7230-0.7150 (Key-Zone) where recent weak bullish recovery was manifested earlier in September.
An atypical Head and Shoulders pattern is being expressed on the depicted chart indicating a high probability of bearish reversal.
The current price levels of 0.7320-0.7350 can be watched for a valid SELL entry if enough bearish rejection is expressed.
Breakdown of the neckline 0.7150 confirms the reversal pattern. Expected bearish targets are located around 0.7050, 0.6925 and eventually 0.6800.


