


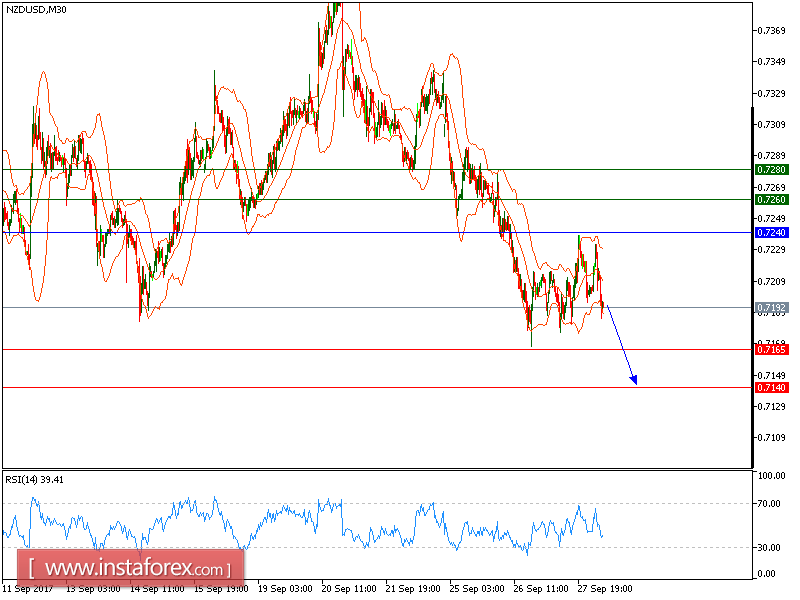
NZD/USD is expected to trade with a bearish outlook. The pair is trading below its key resistance at 0.7240, which should limit the upside potential. The 20-period moving average has crossed below the 50-period one. The relative strength index is supported by a bearish trend line.
Hence, as long as 0.7240 holds on the downside, look for the continuation of the downside to 0.7165 and even to 0.7140 in extension.
The black line is showing the pivot point. Currently, the price is above the pivot point, which indicates long positions. If it remains below the pivot point, it will indicate short positions. The red lines are showing the support levels and the green line is indicating the resistance levels. These levels can be used to enter and exit trades.
Resistance levels: 0.7260, 0.7280, and 0.7305
Support levels: 0.7165, 0.7130, and 0.7100


