


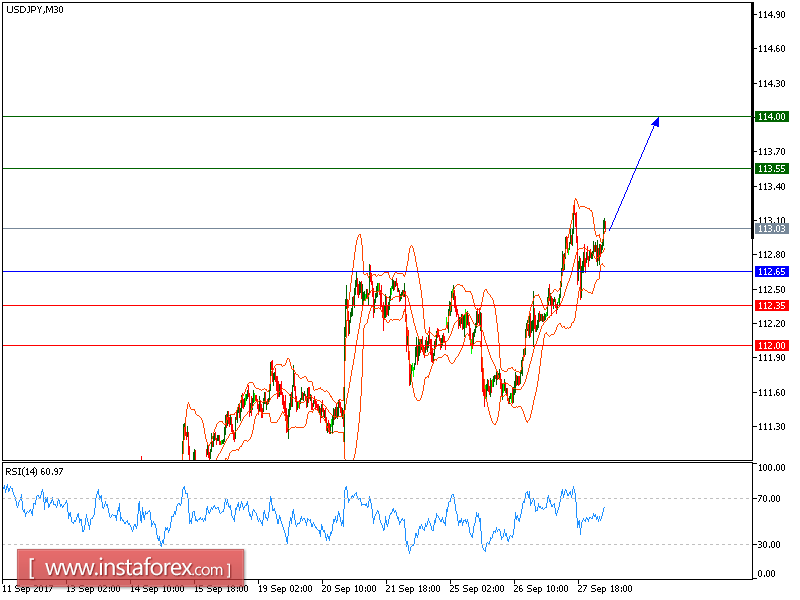
All our targets which we predicted in Yesterday's analysis have been hit and still expected to move in upward direction. The pair is trading its key support at 112.65, which should limit the downside potential. The 20-period moving average has crossed above the 50-period one. The relative strength index is supported by a bullish trend line.
Hence, as long as 112.65 holds on the downside, look for the continuation of the rebound to 113.55 and even to 114 in extension.
Alternatively, if the price moves in the opposite direction, a short position is recommended below 112.65 with a target at 112.35.
Chart Explanation: The black line shows the pivot point. The current price above the pivot point indicates a bullish position, while the price below the pivot point is a signal for a short position. The red lines show the support levels and the green line indicates the resistance level. These levels can be used to enter and exit trades.
Strategy: BUY, Stop Loss: 112.65, Take Profit: 113.55
Resistance levels: 113.55, 114.00 and 114.40 Support Levels: 112.35, 112.00, 111.50


