


FX.co ★ Actual patterns. Technical analysis and trading recommendations
Actual patterns

Double Top
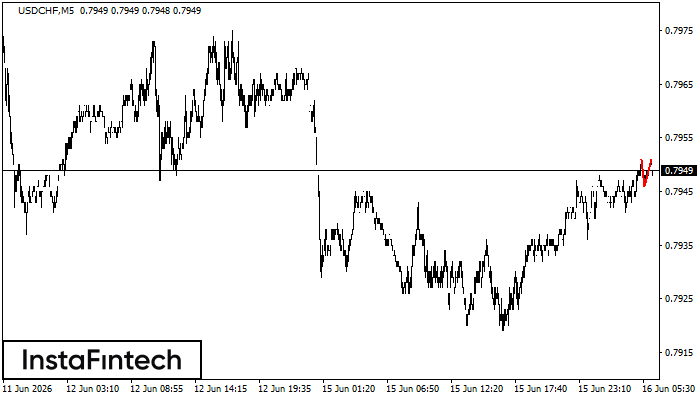
The Double Top reversal pattern has been formed on USDCHF M5. Characteristics: the upper boundary 0.7951; the lower boundary 0.7946; the width of the pattern is 5 points. Sell trades are better to be opened below the lower boundary 0.7946 with a possible movements towards the 0.7931 level.
Triple Top
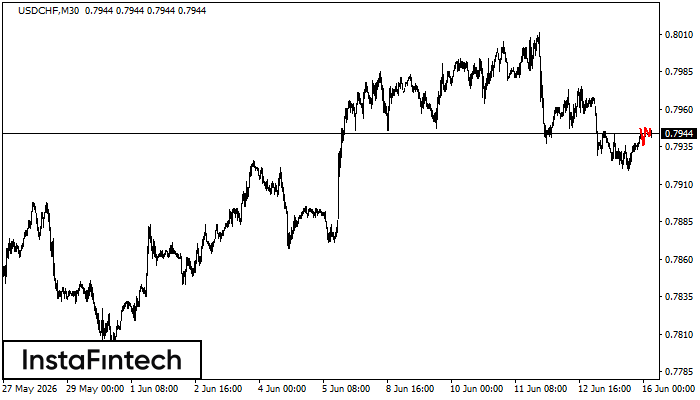
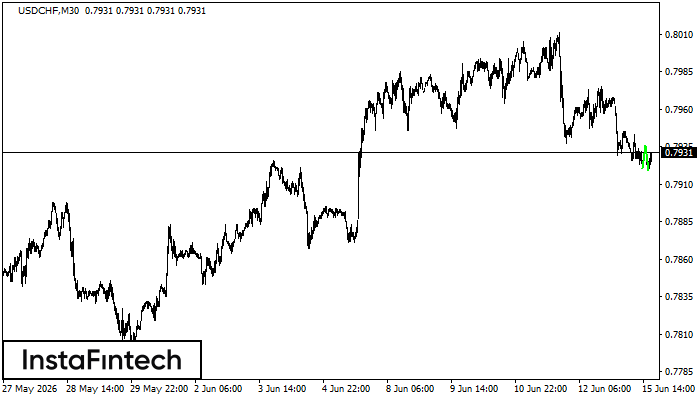
On the chart of the USDCHF M30 trading instrument, the Triple Top pattern that signals a trend change has formed. It is possible that after formation of the third peak, the price will try to break through the resistance level 0.7936, where we advise to open a trading position for sale. Take profit is the projection of the pattern’s width, which is 11 points.
Triple Top
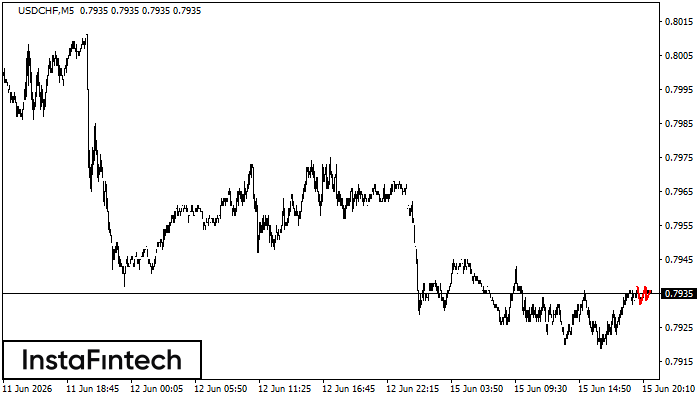
On the chart of the USDCHF M5 trading instrument, the Triple Top pattern that signals a trend change has formed. It is possible that after formation of the third peak, the price will try to break through the resistance level 0.7932, where we advise to open a trading position for sale. Take profit is the projection of the pattern’s width, which is 5 points.
Double Top
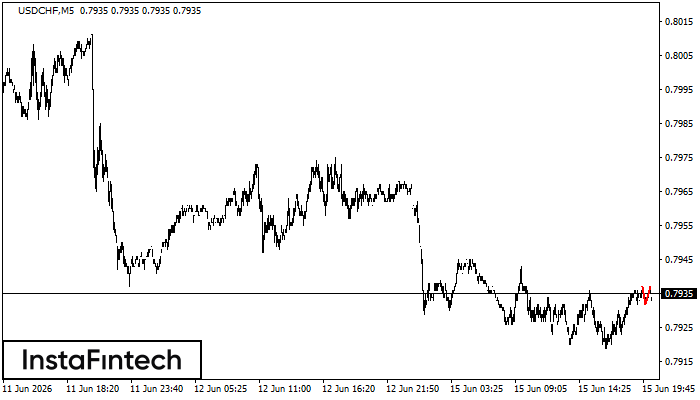
The Double Top pattern has been formed on USDCHF M5. It signals that the trend has been changed from upwards to downwards. Probably, if the base of the pattern 0.7932 is broken, the downward movement will continue.
Double Bottom
The Double Bottom pattern has been formed on USDCHF M30. Characteristics: the support level 0.7920; the resistance level 0.7936; the width of the pattern 16 points. If the resistance level is broken, a change in the trend can be predicted with the first target point lying at the distance of 17 points.


