


FX.co ★ Actual patterns. Technical analysis and trading recommendations
Actual patterns

Bullish Rectangle
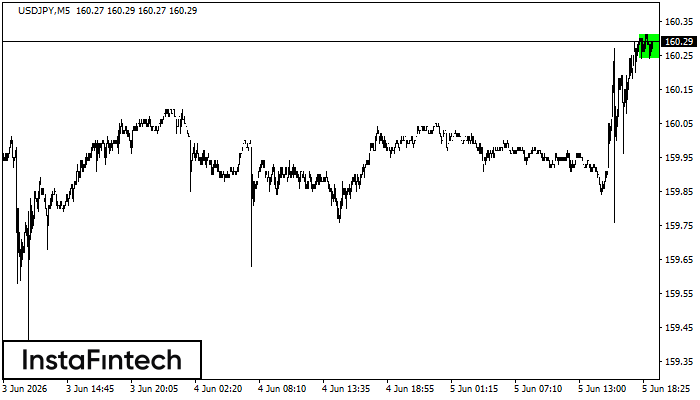
According to the chart of M5, USDJPY formed the Bullish Rectangle. This type of a pattern indicates a trend continuation. It consists of two levels: resistance 160.31 and support 160.24. In case the resistance level 160.31 - 160.31 is broken, the instrument is likely to follow the bullish trend.
Triple Top
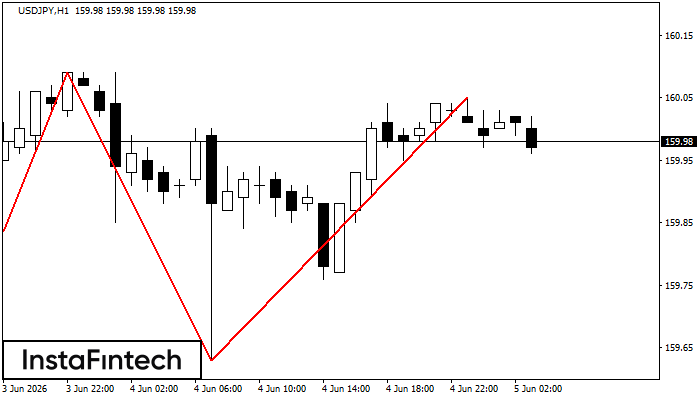
On the chart of the USDJPY H1 trading instrument, the Triple Top pattern that signals a trend change has formed. It is possible that after formation of the third peak, the price will try to break through the resistance level 159.39, where we advise to open a trading position for sale. Take profit is the projection of the pattern’s width, which is 62 points.
Double Top
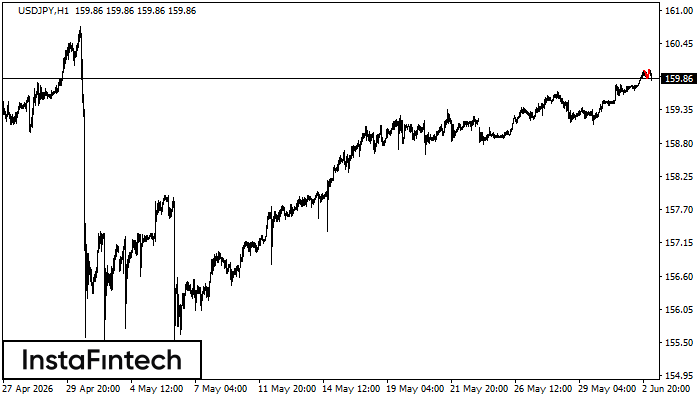
The Double Top reversal pattern has been formed on USDJPY H1. Characteristics: the upper boundary 160.00; the lower boundary 159.87; the width of the pattern is 14 points. Sell trades are better to be opened below the lower boundary 159.87 with a possible movements towards the 159.47 level.
Double Top
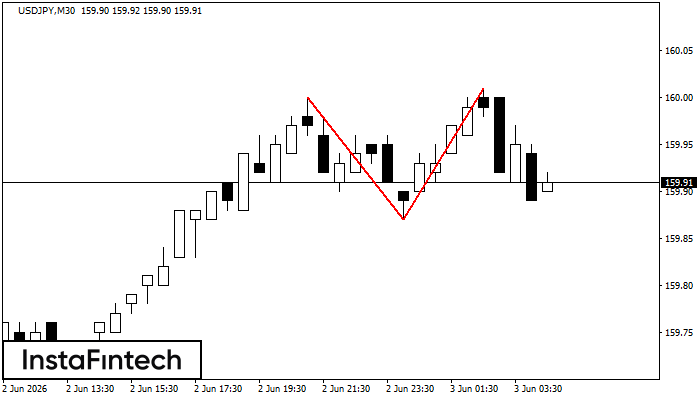
The Double Top reversal pattern has been formed on USDJPY M30. Characteristics: the upper boundary 160.00; the lower boundary 159.87; the width of the pattern is 14 points. Sell trades are better to be opened below the lower boundary 159.87 with a possible movements towards the 159.57 level.
Bullish Flag
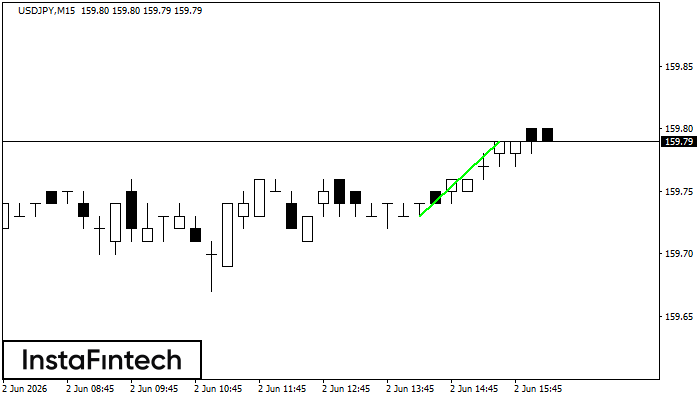
The Bullish Flag pattern has been formed on the chart USDJPY M15 which signals that the upward trend will continue. Signals: а break of the peak at 159.79 may push the price higher, and the rise will be the projection of the pole.


