


FX.co ★ Actual patterns. Technical analysis and trading recommendations
Actual patterns

Bearish Flag

The Bearish Flag pattern has been formed on the chart NZDCAD M15. Therefore, the downwards trend is likely to continue in the nearest term. As soon as the price breaks below the low at 0.8069, traders should enter the market.
Bearish pennant
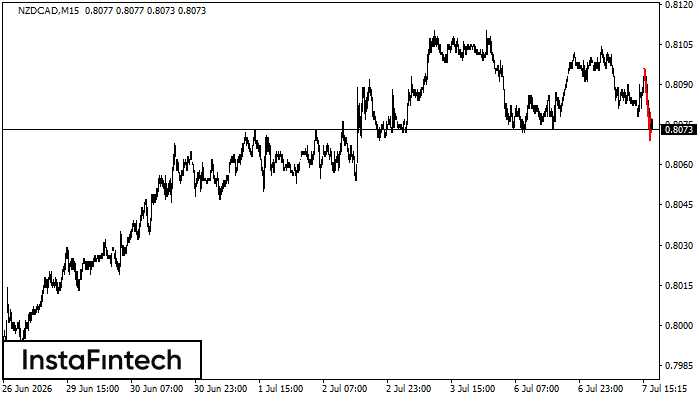
The Bearish pennant pattern has formed on the NZDCAD M15 chart. This pattern type is characterized by a slight slowdown after which the price will move in the direction of the original trend. In case the price fixes below the pattern’s low of 0.8069, a trader will be able to successfully enter the sell position.
Bullish Symmetrical Triangle
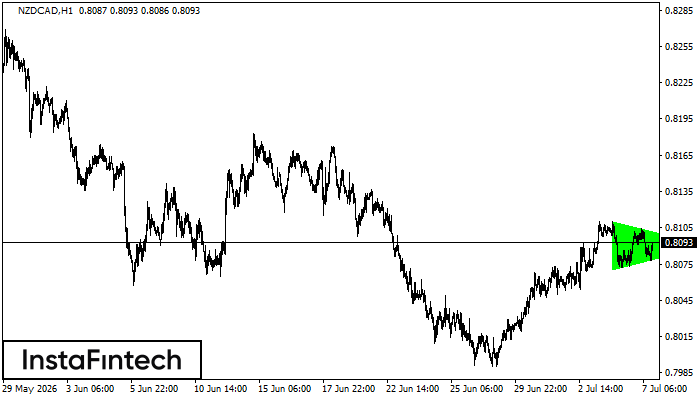
According to the chart of H1, NZDCAD formed the Bullish Symmetrical Triangle pattern. The lower border of the pattern touches the coordinates 0.8070/0.8090 whereas the upper border goes across 0.8110/0.8090. If the Bullish Symmetrical Triangle pattern is in progress, this evidently signals a further upward trend. In other words, in case the scenario comes true, the price of NZDCAD will breach the upper border to head for 0.8130.
Bullish Symmetrical Triangle
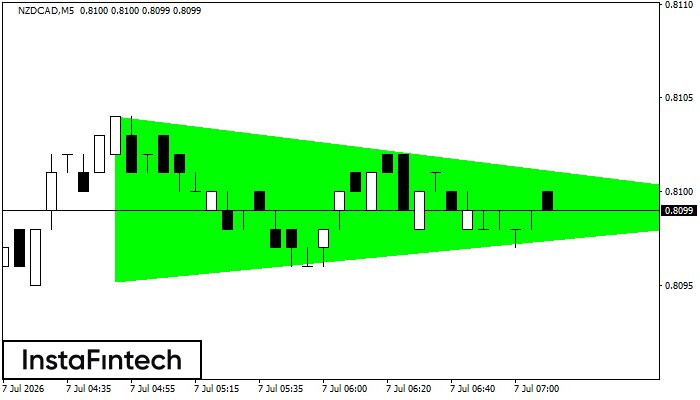
According to the chart of M5, NZDCAD formed the Bullish Symmetrical Triangle pattern, which signals the trend will continue. Description. The upper border of the pattern touches the coordinates 0.8104/0.8099 whereas the lower border goes across 0.8095/0.8099. The pattern width is measured on the chart at 9 pips. If the Bullish Symmetrical Triangle pattern is in progress during the upward trend, this indicates the current trend will go on. In case 0.8099 is broken, the price could continue its move toward 0.8114.
Bearish Symmetrical Triangle
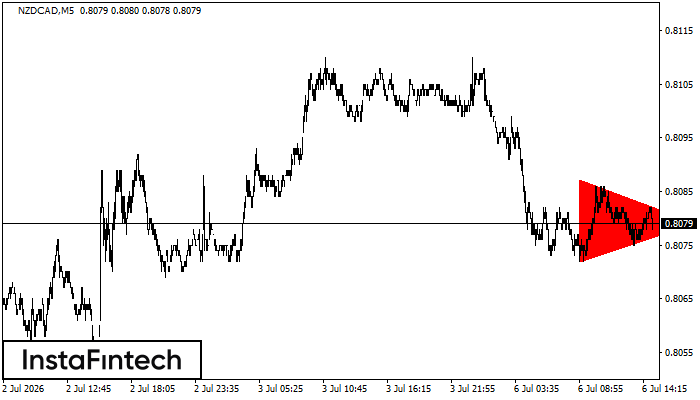
According to the chart of M5, NZDCAD formed the Bearish Symmetrical Triangle pattern. Trading recommendations: A breach of the lower border 0.8072 is likely to encourage a continuation of the downward trend.


